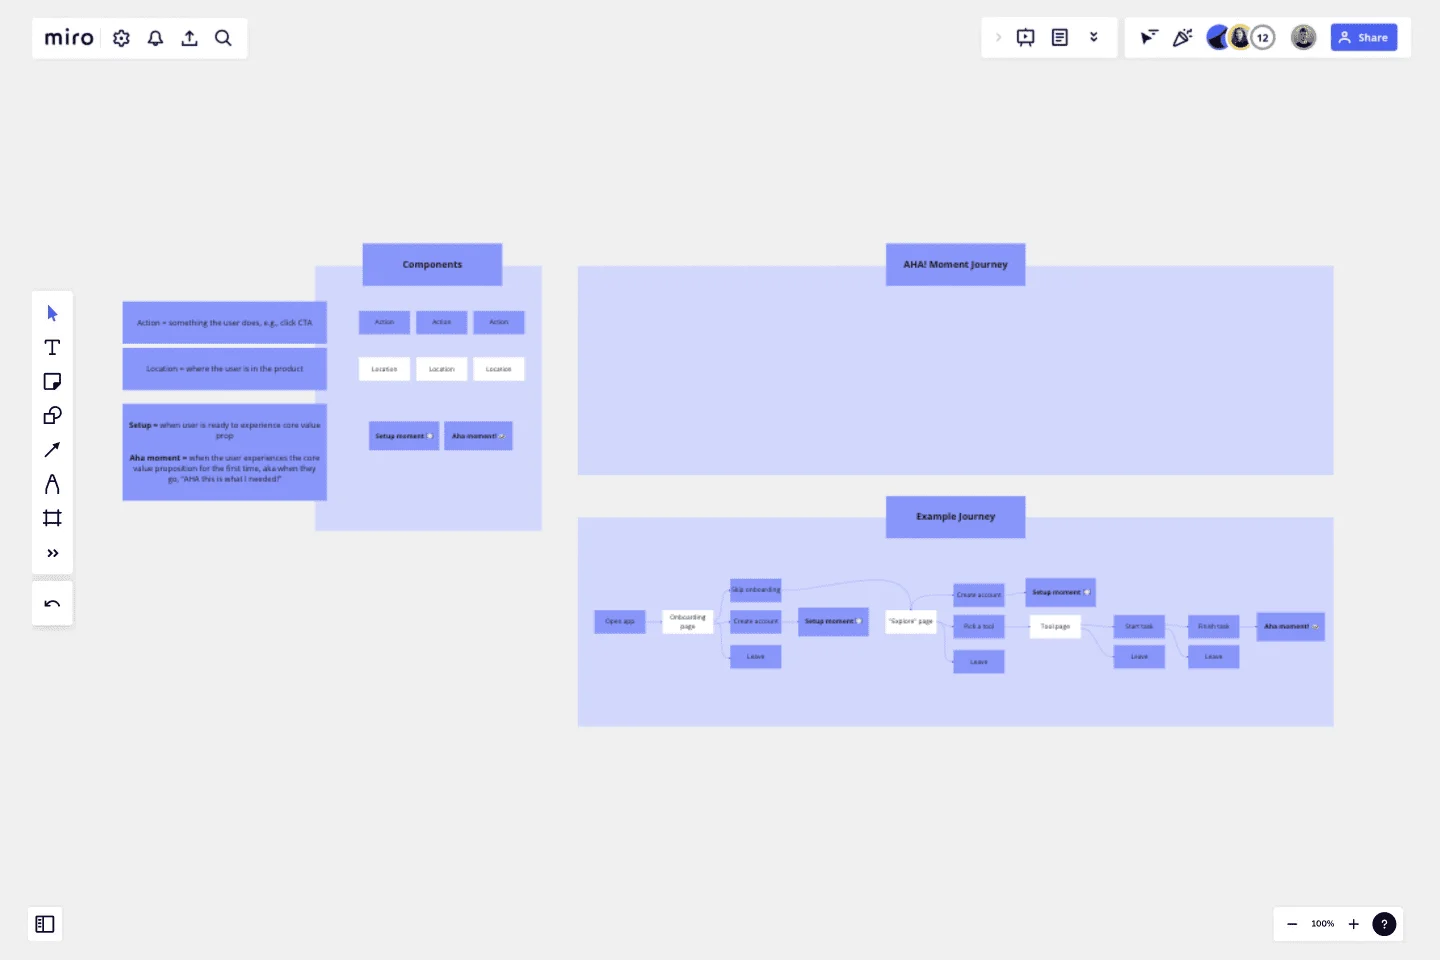
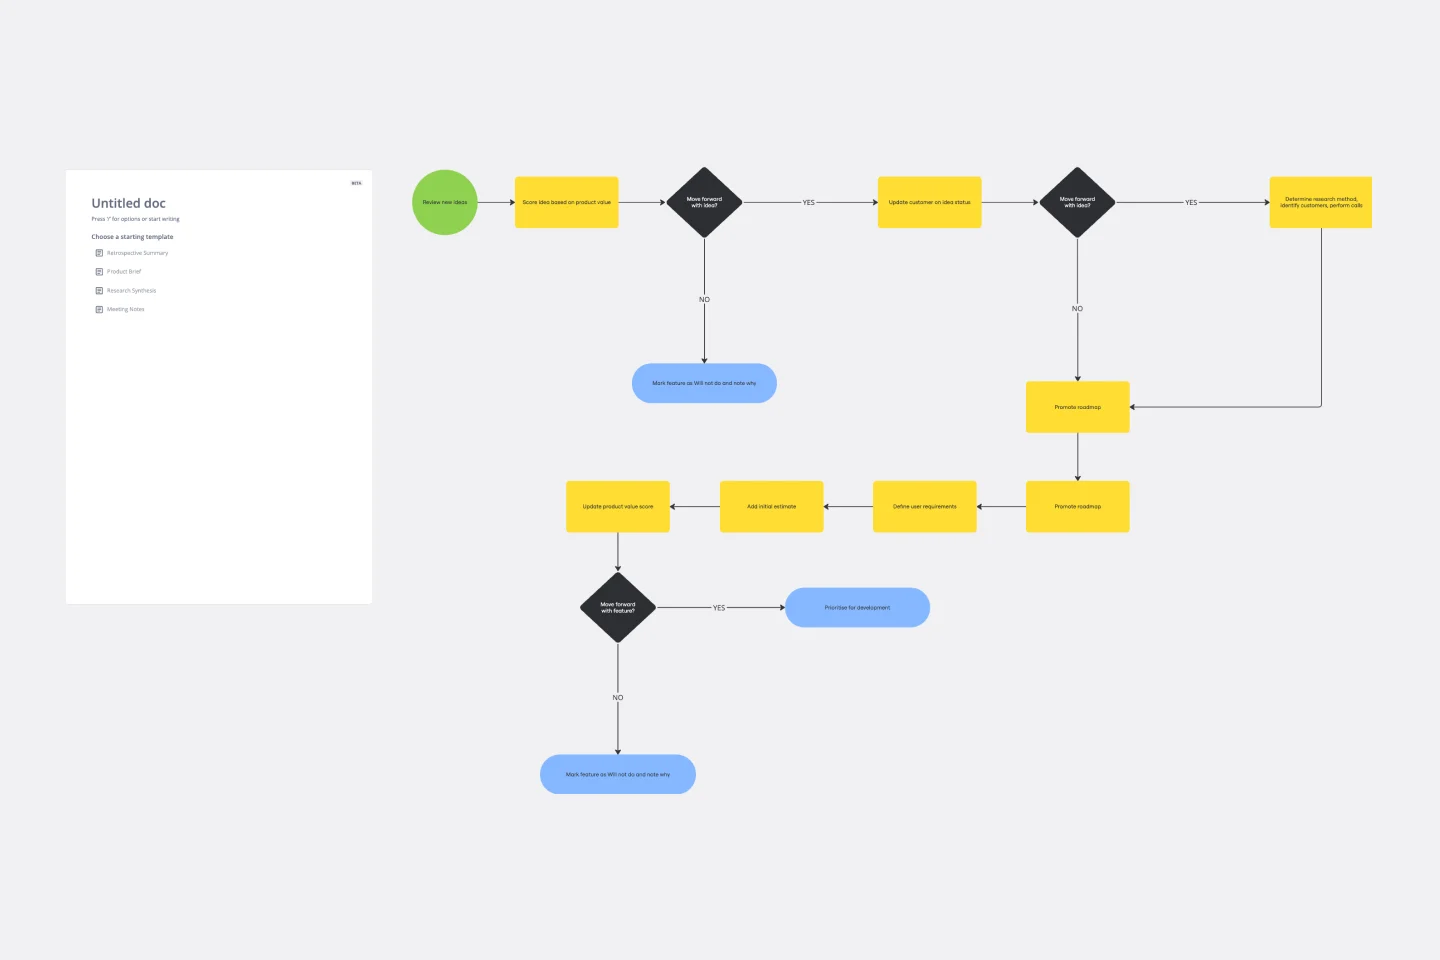
AHA! Moment Flowchart
Break down the user journey to the first aha moment!
The aha moment is the first time the user experiences the core value proposition. Mapping out the journey will help you to identify the roadblocks that might hinder your users from experiencing the benefit you intend to bring with your product.
Make sure to map out every action and every page the user visits in order to pin point potential UX issues to fix. Have fun!
Get started with this template right now.
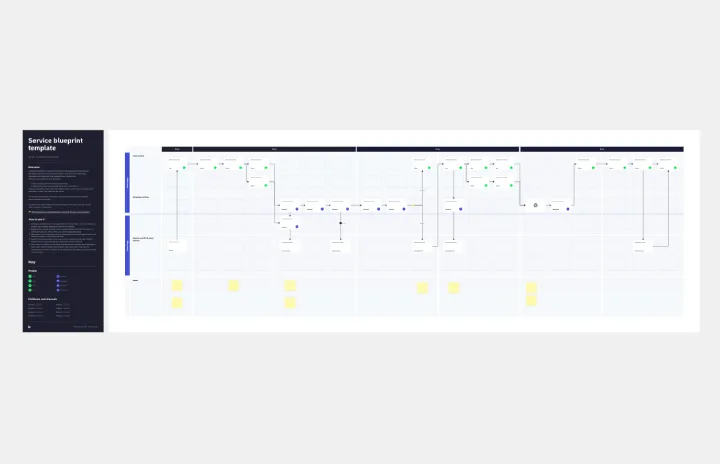
Service Blueprint by Hyperact
Works best for:
Research & Design
The Service Blueprint template is perfect for visualizing the orchestration of service components. It maps out frontstage and backstage elements, helping you analyze and enhance customer experiences. Use this template to align teams, identify pain points, and streamline processes, ensuring a seamless service delivery. It's ideal for creating a shared understanding of service dynamics among stakeholders and collaborators.
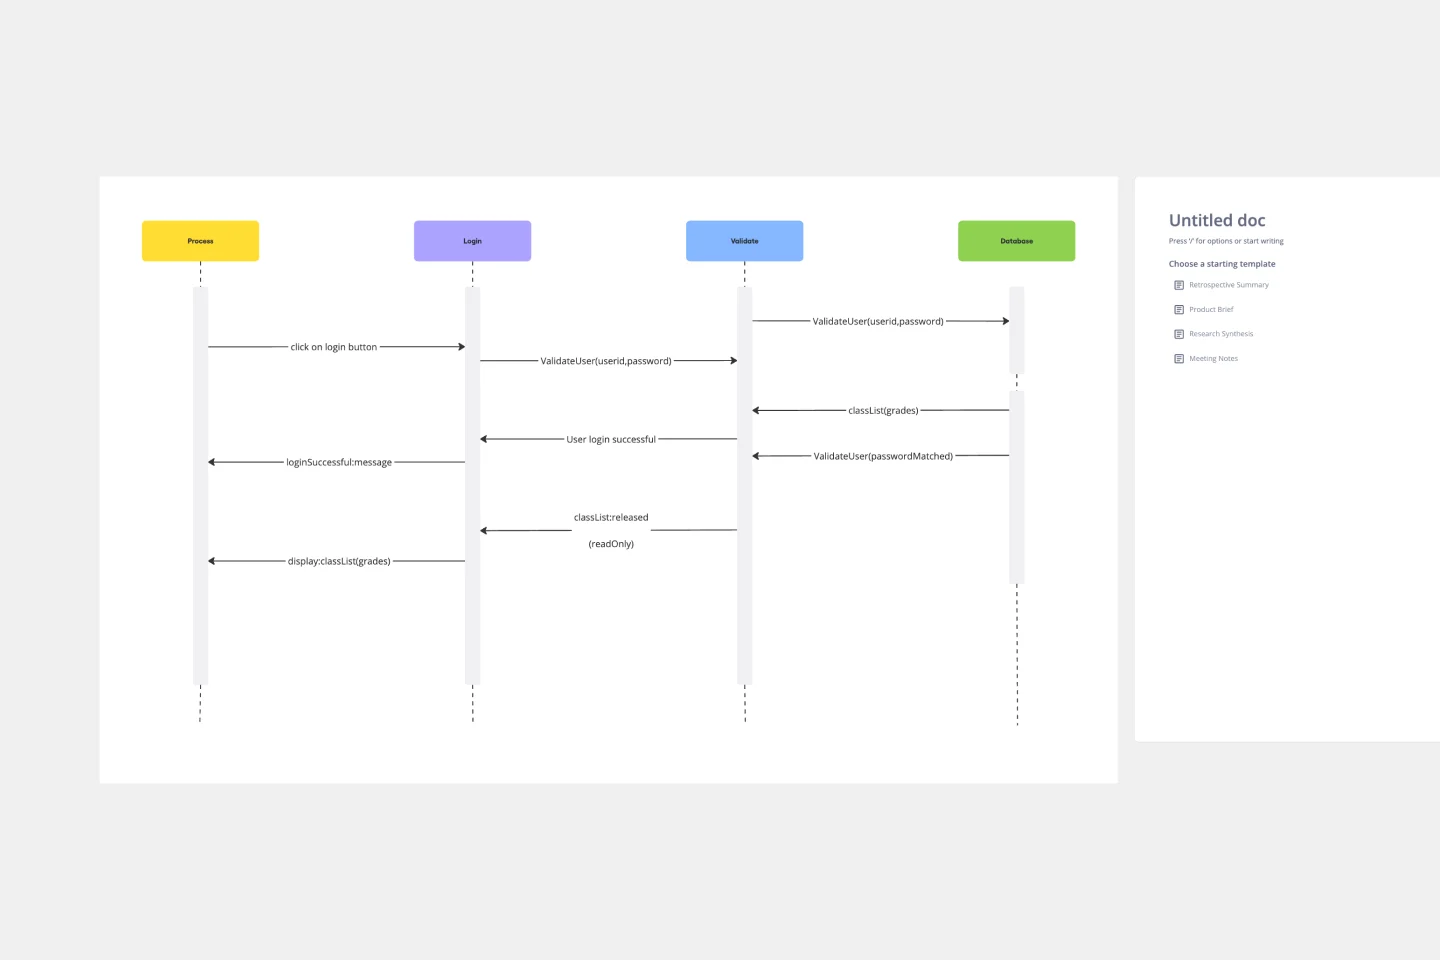
Login Sequence Diagram Template
Works best for:
Diagramming, Technical Diagramming
The UML Sequence Login Diagram Template is a valuable tool for visualizing user authentication processes. It breaks down complex login sequences into clear, visual components, facilitating collaborative understanding among team members, regardless of their technical expertise. This shared understanding is crucial for ensuring all stakeholders, from developers to project managers, are on the same page, leading to efficient decision-making and a smoother development process. The template's ability to translate technical details into an accessible format streamlines communication and significantly reduces the likelihood of misinterpretation or oversight, making it an essential asset in any software development project.
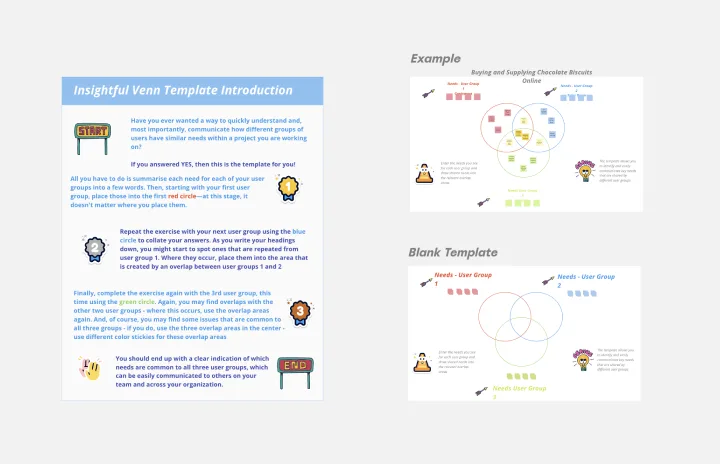
Insightful Venn
Works best for:
Venn Diagram
Discover insights and visualize data relationships with the Insightful Venn template. This tool helps you compare multiple datasets, identify intersections, and understand unique and common elements. Use it for data analysis, research, and presentations to communicate complex information effectively. Perfect for analysts, educators, and researchers aiming to convey data-driven insights visually.
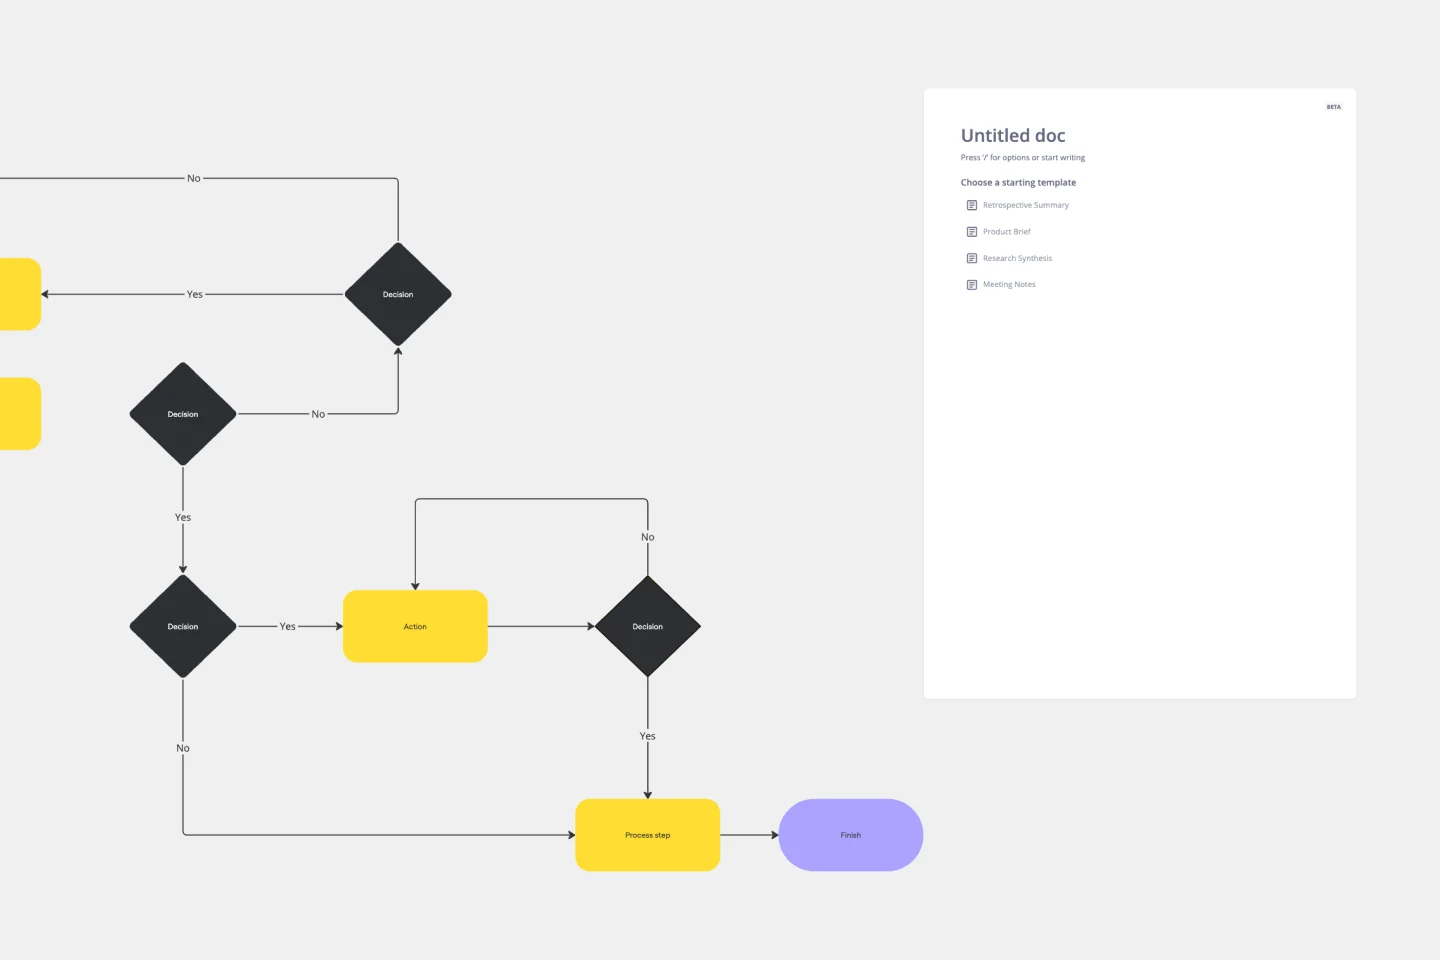
Workflow Diagram Template
Works best for:
Diagramming, Mapping, Process mapping
The Workflow Diagram Template maps out and represents processes or systems using standardized symbols and shapes. By delineating the various steps or stages in a process, it ensures that tasks flow seamlessly from initiation to completion. One of the standout benefits of using this template is its clarity. By translating processes into a visual format, all participants can gain a comprehensive understanding at a glance, eliminating confusion and ensuring everyone is on the same page. This clarity not only promotes efficient task execution but also fosters collaboration among team members.
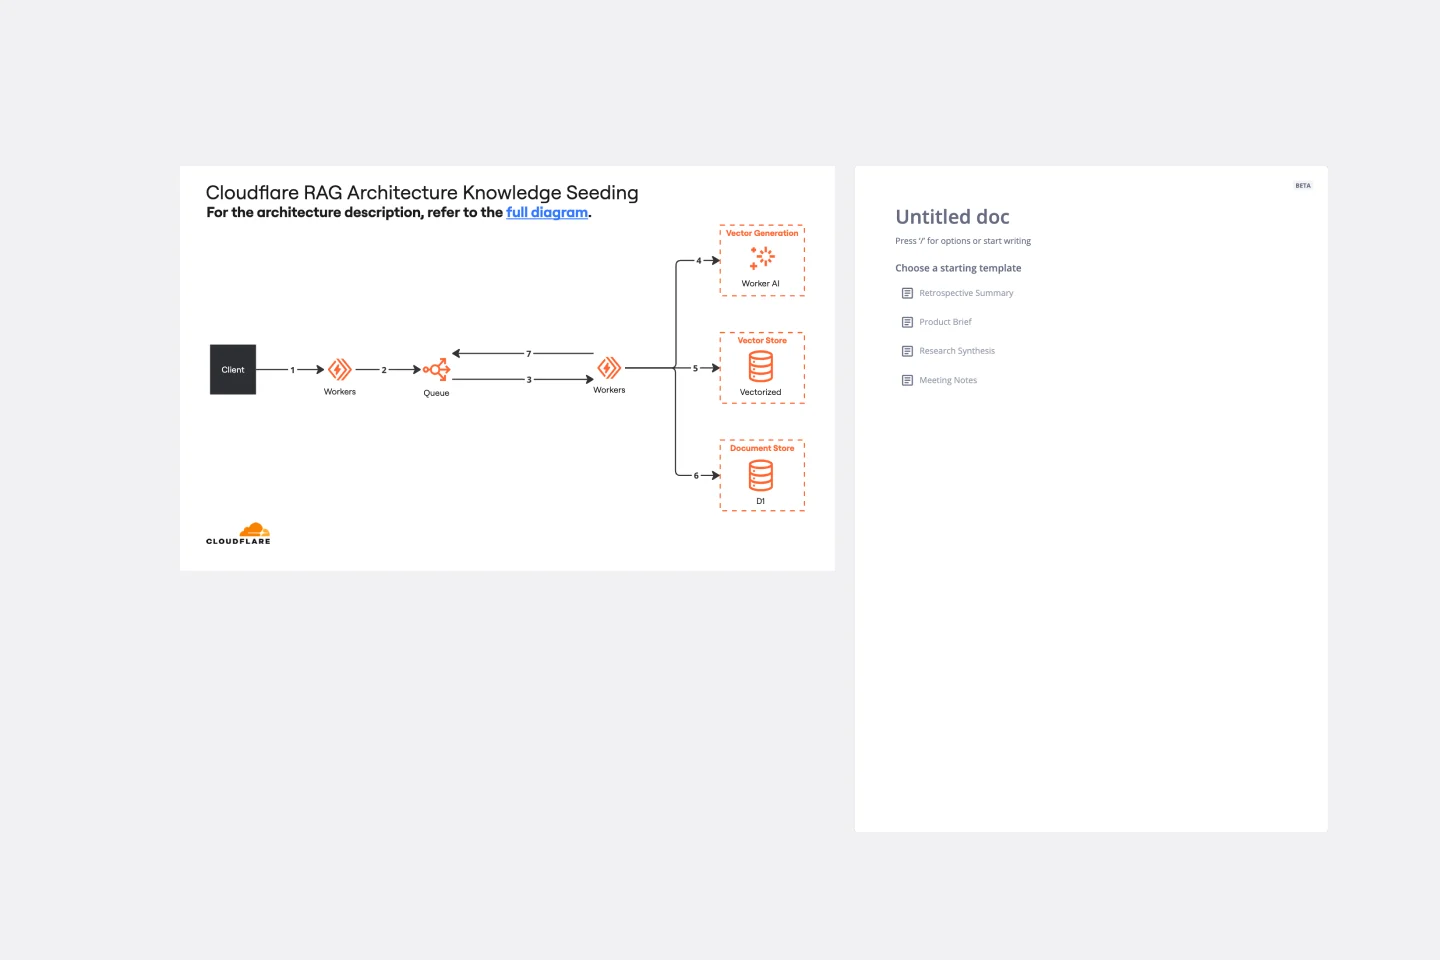
Cloudflare RAG Architecture Knowledge Seeding Template
The Cloudflare RAG Architecture Knowledge Seeding template in Miro streamlines the sharing and visualization of cloud architecture knowledge, making it ideal for tasks like cloud infrastructure optimization and diagram creation. This template enables straightforward documentation and collaboration, ensuring complex information is accessible to all team members.
Production Flowchart Template
Works best for:
Flowcharts
The Production Flowchart Template is a well-crafted tool that clearly represents a production process from start to finish. It breaks down complex procedures into easy-to-understand segments, making it easier for stakeholders to grasp the entire process. One of the key benefits of using this template is that it helps to clarify complex production pathways. By mapping out operations visually, teams can identify potential bottlenecks or inefficiencies, facilitating timely and well-informed decision-making.