Assumption Grid Template
Make decisions with confidence with the assumption grid template.
About the Assumption Grid Template
Most business models and decisions are based on assumptions. Whether you’re a startup, an enterprise company, or somewhere in between, you’re probably making assumptions almost every day. But when resources and time are on the line, it can be hard to decide whether your assumptions are worth making -- and if you’re making tough judgment calls, it’s not always easy to know which assumptions to test.
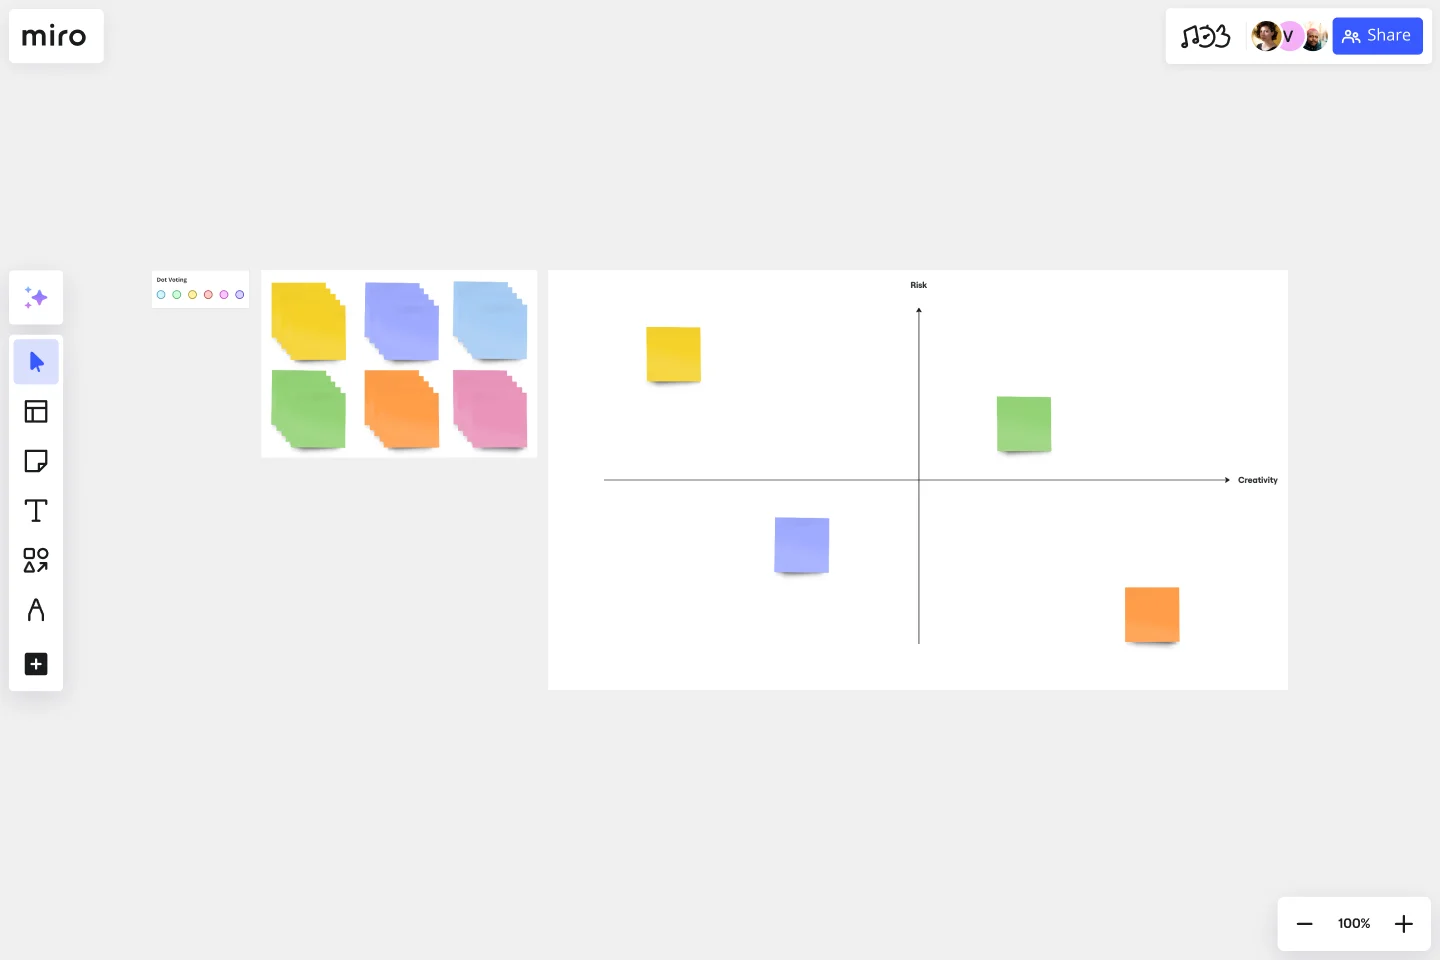
Developed by IBM, an Assumption Grid is a powerful tool that helps you decide which assumptions from your business model you should test first. The grid plots your assumptions on two axes: high impact assumptions for which you have little information, and low impact assumptions for which you have little information. Visualizing your assumptions can empower you to make judgment calls, prioritize, mitigate risk, and overcome uncertainties.
Once you’ve placed a variety of items on the grid, the Assumption Grid becomes a great conversational tool. Bring your team into a room and have them go over the results. New assumptions might materialize, or you might move items around on the grid.
How do you use the assumption grid template?
Here are the steps to use our template effectively: 1. Customize the template according to your specific requirements. 2. Invite team members to join your board and collaborate with you. 3. Create color-coded sticky notes to keep track of each person’s contributions. 4. Use the username or video chat feature if you require input from others. 5. Upload various file types, such as documents, photos, videos, and PDFs, to store all the relevant information in one place. By following these steps, you can effectively use our assumption grid template and streamline your team's workflow.
When should you use the Assumption Grid template?
IBM recommends using the Assumption Grid as often as possible, and that is sound advice. For most organizations, risk is the only constant. The sooner you can recognize and evaluate your teams’ assumptions, the more quickly you can mitigate potential risk and make judgment calls. You can use the Assumption Grid anytime you’d like to promote critical thinking about your ideas. The grid prompts you to consider levels of certainty and risk, which can help you and your team to uncover some of your biases and unfounded beliefs. The Assumption Grid is also a useful tool for overcoming decision-making roadblocks. If your team is divided on a decision, bring everyone together to build an Assumption Grid. The ensuing conversations might clarify goals and expectations.
Get started with this template right now.
3 Horizons of Growth Template
Works best for:
Leadership, Strategic Planning, Project Planning
Featured in The Alchemy of Growth, this model gives ambitious companies a way to balance the present and the future—in other words, what’s working in the existing business and what emerging, possibly-profitable growth opportunities lie ahead. Then teams across the organization can make sure that their projects map to and support the organization’s goals. The 3 Horizons of Growth model is also a powerful way to foster a culture of innovation—one that values and depends on experimentation and iteration—and to identify opportunities for new business.
Elevator Pitch Template
Works best for:
Leadership, Marketing
Come together as a team and create a powerful Elevator Pitch with Miro’s template. Move projects forward and get your product idea funded with a killer storyline.
Corrective Action Plan Template
Works best for:
Project Management, Operations, Strategic Planning
For a manager or HR leader, it’s the least fun part of the job: Documenting an employee’s performance issues and talking about them directly to that employee. A corrective action plan makes that tough task a little easier by putting issues into a professional, written framework. That way the process, next steps, and details of the conversations are all clearly documented. This template will enable you to eliminate murky communication, align on expectations, and provide step-by-step instructions for your employee.
Stakeholder Analysis Template
Works best for:
Project Management, Strategic Planning, Project Planning
Managing stakeholders is integral to completing a project on time and meeting expectations, so here’s how to use a stakeholder analysis to help. A stakeholder analysis empowers you to meet expectations and complete projects on time by identifying individuals, groups, and organizations with a vested interest in a program or process. In a typical stakeholder analysis, you’ll prioritize stakeholders based on their influence on a project and seek to understand how best to interface with them throughout the course of the project.
Executive Summary Template
Works best for:
Leadership, Project Management, Documentation
Pique their curiosity. Get them excited. Inspire them to keep reading, diving further into your proposal details. That’s what a good executive summary has the power to do—and why it’s a crucial opening statement for business plans, project plans, investment proposals, and more. Use this template to create an executive summary that starts building belief, by answering high-level questions that include: What is your project? What are the goals? How will you bring your skills and resources to the project? And who can expect to benefit?
Scenario Mapping Template
Works best for:
Desk Research, Mapping, Product Management
Scenario mapping is the process of outlining all the steps a user will take to complete a task. The scenario mapping template helps you create a visual guide to what different personas are doing, thinking, and feeling in different situations. Use scenario mapping to outline an intended or ideal scenario (what should happen) as well as what currently happens. If you’re trying to outline the ideal scenario, user mapping should take place very early on in a project and can help inform user stories and the product backlog. If you’re just trying to get a better sense of what currently happens, you can do user mapping when conducting user interviews or observation.
