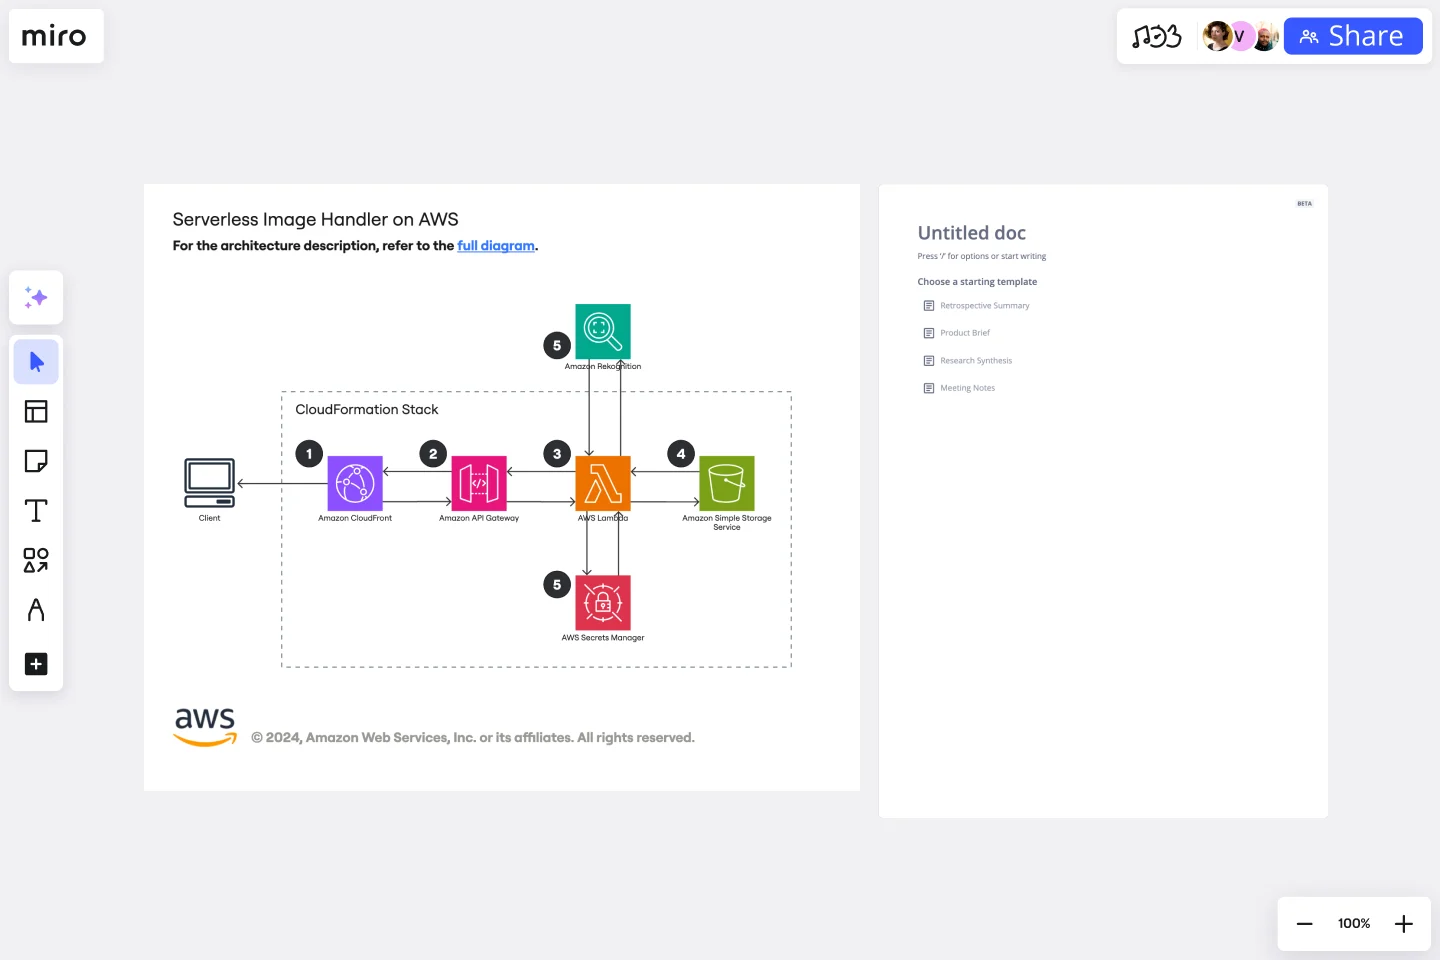
Serverless Image Handler on AWS Template
Handle image management and transformation in cloud-based projects, eliminating the need for server infrastructure management with the Serverless Image Handler on AWS Template.
Available on Enterprise, Business, Education plans.
About the Serverless Image Handler on AWS Template
The Serverless Image Handler on AWS template is designed to streamline managing and transforming images in the cloud without needing to manage server infrastructure. This solution leverages AWS services to automatically handle common image manipulation tasks, such as resizing, cropping, and formatting, making it an efficient tool for applications requiring dynamic image management.
How to use the Serverless Image Handler on AWS Template
Edit the template: Use Miro's intuitive drag-and-drop interface to customize the template according to your project's requirements. You can add or remove shapes, and use relevant AWS shape packs.
Analyze and collaborate: Collaborate with team members by sharing insights and making real-time updates to the template.
Iterate and optimize: Based on your analysis and team feedback, iterate on your data connections and analysis within the template. Miro's flexible nature allows for continuous optimization of your data analysis processes.
Why use the Serverless Image Handler on AWS Template
Using the Serverless Image Handler on AWS template in Miro could offer several benefits, such as:
Efficiency: Automating image manipulation tasks directly within project boards can streamline workflows, especially for teams dealing with dynamic content or digital assets.
Scalability: Leveraging AWS's serverless architecture can help teams scale their image-handling needs without worrying about infrastructure.
Integration: For teams utilizing AWS for their projects, this template can provide a seamless way to incorporate cloud-based image handling into their Miro boards.
Get started with this template right now. Available on Enterprise, Business, Education plans.
ERD Blogging System Template
Works best for:
ERD
The ERD Blogging System template in Miro efficiently manages and organizes digital content. It features key entities such as User, Post, Comment, Category, Tag, and File, which are essential for managing the creation and publication of blog posts, engaging users through comments, and organizing content via categories and tags. Additionally, it supports media attachments through the File entity, linking them to the relevant content. This template helps streamline the blogging process, making it an invaluable tool for content management and publication.
UML Sequence Rental Booking System Template
Works best for:
UML
The UML Sequence Rental Booking System Template streamlines the process of documenting and visualizing the interactions within a car rental booking system. This template maps out the communication flow between the customer, user interface, payment service, and vehicle allocation system, ensuring a smooth and efficient workflow. By providing a clear visual representation of these interactions, the template helps in improving understanding among team members and stakeholders, promoting efficient design and collaboration.
LUMINAI Refinery Advisor on AWS Template
Works best for:
AWS
The LUMINAI Refinery Advisor on AWS template streamlines and optimizes refinery operations through AWS. It provides a structured approach to setting up and managing AWS services, tailored specifically for engineers, developers, and data scientists in the refinery sector. This template not only saves time and effort by offering a predefined structure and best practices but also allows for customization to meet specific operational needs. With its focus on enhancing data processing capabilities, the LUMINAI Refinery Advisor on AWS template is an invaluable resource for improving the efficiency, effectiveness, and optimization of refinery processes on the AWS platform.
Automated Security Response on AWS Template
Works best for:
AWS
The Automated Security Response on AWS template is a tool for enhancing AWS security through automation, enabling quick identification and mitigation of threats with minimal manual effort. It integrates with AWS security services for a dynamic response mechanism, ensuring infrastructure security against evolving threats. This template streamlines operational efficiency, offers scalable and customizable security strategies, and accelerates threat response times, making it essential for improving AWS security posture.
Datavant Switchboard with AWS Clean Rooms Template
Works best for:
AWS
The AWS Datavant Switchboard Clean Rooms Template integrates health data sources using Datavant's secure data connection capabilities and AWS Clean Rooms' scalable data processing environment. It's useful for professionals in engineering, database management, and development. The customizable Miro interface streamlines secure and efficient data handling and team collaboration for a wide range of projects.
Vertical Organizational Chart
Works best for:
Organizational Charts, Organizational Design
The Vertical Organizational Chart Template is an efficient way to illustrate the hierarchy of an entity in a top-down format. This tool helps represent roles and relationships in a clear manner, starting from the topmost authority and branching downwards. It allows for a better understanding of the flow of responsibilities and communication channels within the organization. One of its most significant advantages is promoting clear communication. Depicting the organization's structure helps avoid misunderstandings and ensures everyone is on the same page regarding the chain of command.
