Azure Data Flow Template
Combine data and build and deploy custom machine learning models at scale.
Available on Enterprise, Business, Education plans.
About the Azure Data Flow Template
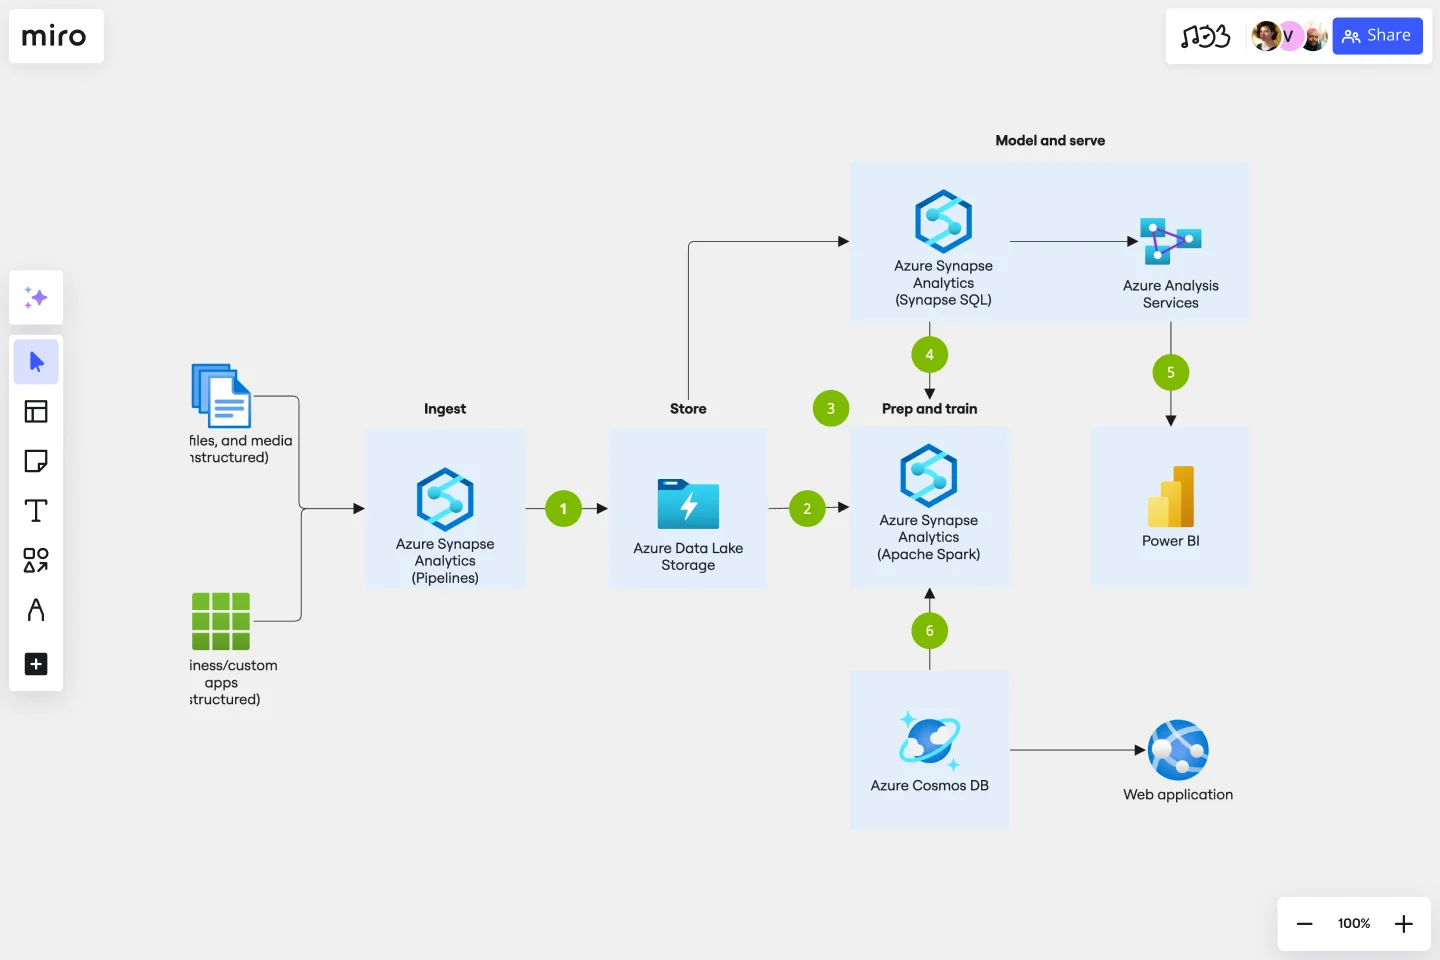
The Azure Data Flow Template will show you how to transform your data into actionable insights using the best-in-class machine learning tools. This architecture allows you to combine data and build and deploy custom machine learning models at scale.
Keep reading to learn more about the Azure Data Flow Template.
What is an Azure Data Flow Template
The Azure Data Flow Template visually shows the data flow to deploy and build custom machine learning models. The Azure Data Flow Template has unique icons categorized into Stencils. Each Stencil focuses on a specific task to make it easier for users to access the right set of icons.
When to use Azure Data Flow Template
You can use the Azure Data Flow Template to transform your data into actionable insights and better inform decision making. Collect data, analyze it, and use it to make decisions surrounding your architecture, from cost data, to performance, to user load, using data will guide you to make the right choices in your environment.
To build your Azure Data Flow Template, check out these best practices:
Do’s
Use the icon to illustrate how products can work together
In diagrams, we recommend to include the product name somewhere close to the icon
Use the icons as they would appear within Azure
Don’ts
Don’t crop, flip or rotate icons
Don’t distort or change icon shape in any way
Don’t use Microsoft product icons to represent your product or service.
How do I make an Azure Data Flow Template?
To make an Azure Data Flow in Miro is easy. You can use our Azure Data Flow Template and customize it as you see fit. Once you have the diagram structure, you can start adding the icons. You can find the icons under our Azure Icon Set integration.
Get started with this template right now. Available on Enterprise, Business, Education plans.
Breakout Group Template
Works best for:
Education, Team Meetings, Workshops
Breakout groups provide an excellent opportunity for teammates to have candid conversations and connect on a more intimate level than is possible during a broader meeting. When you’re in a large group setting, it can be difficult for people to feel safe or comfortable speaking up. In a smaller group, participants can feel safer sharing their ideas. Since the group is more intimate, teams are empowered to participate rather than observe.
HEART Framework Template
Works best for:
Desk Research, Project Management, User Experience
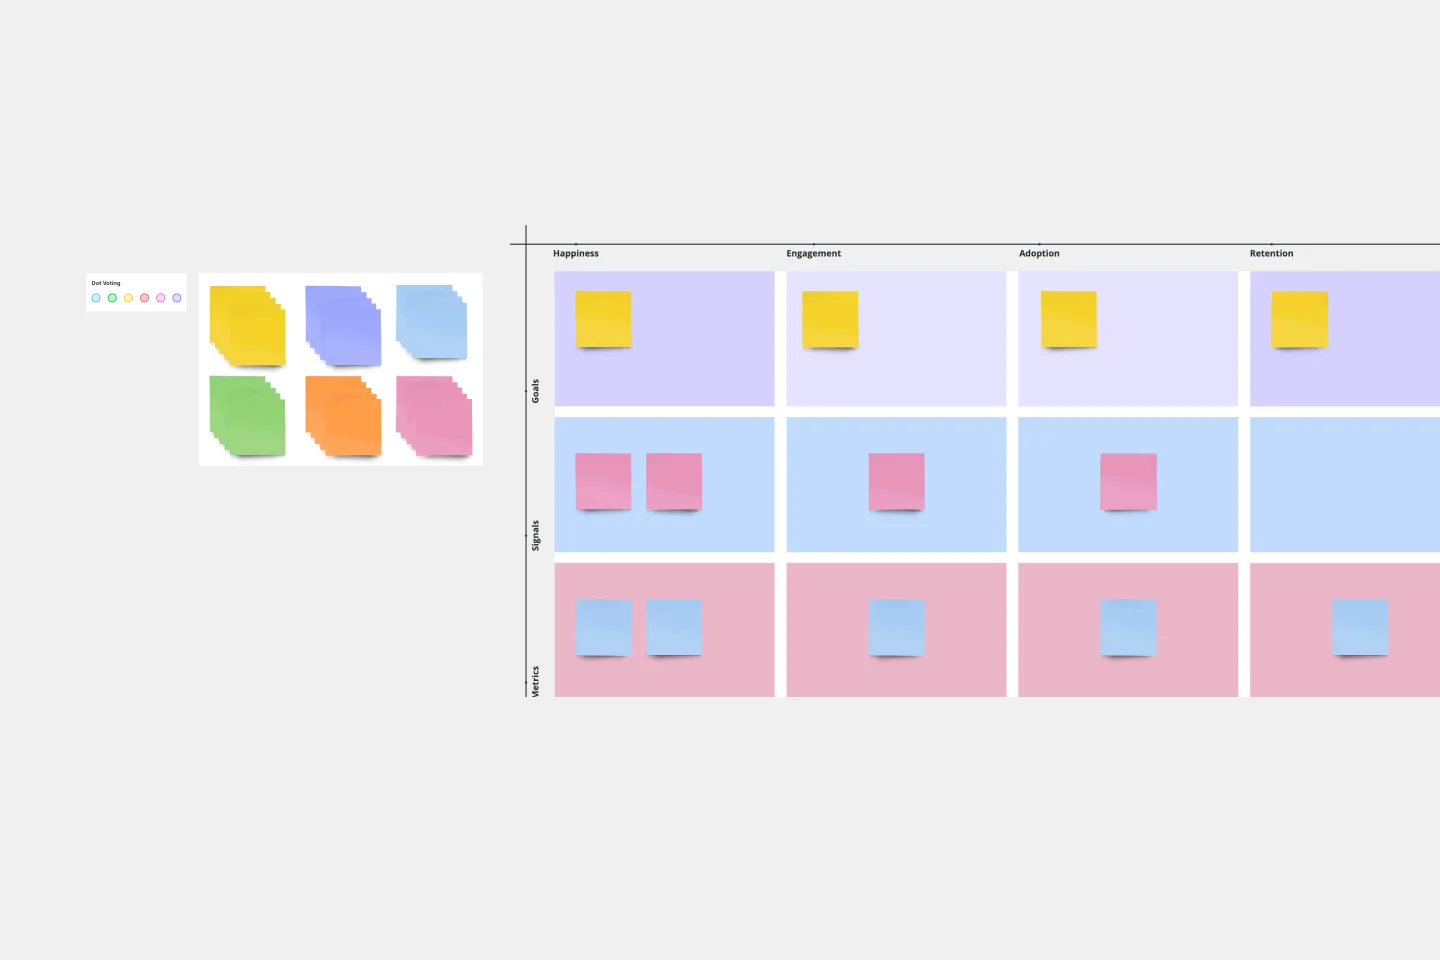
Happiness, Engagement, Adoption, Retention, and Task Success. Those are the pillars of user experience — which is why they serve as the key metrics in the HEART framework. Developed by the research team at Google, this framework gives larger companies an accurate way to measure user experience at scale, which you can then reference throughout the product development lifecycle. While the HEART framework uses five metrics, you might not need all five for every project — choose the ones that will be most useful for your company and project.
Entity Relationship Diagram Template
Works best for:
Flowcharts, Strategic Planning, Diagrams
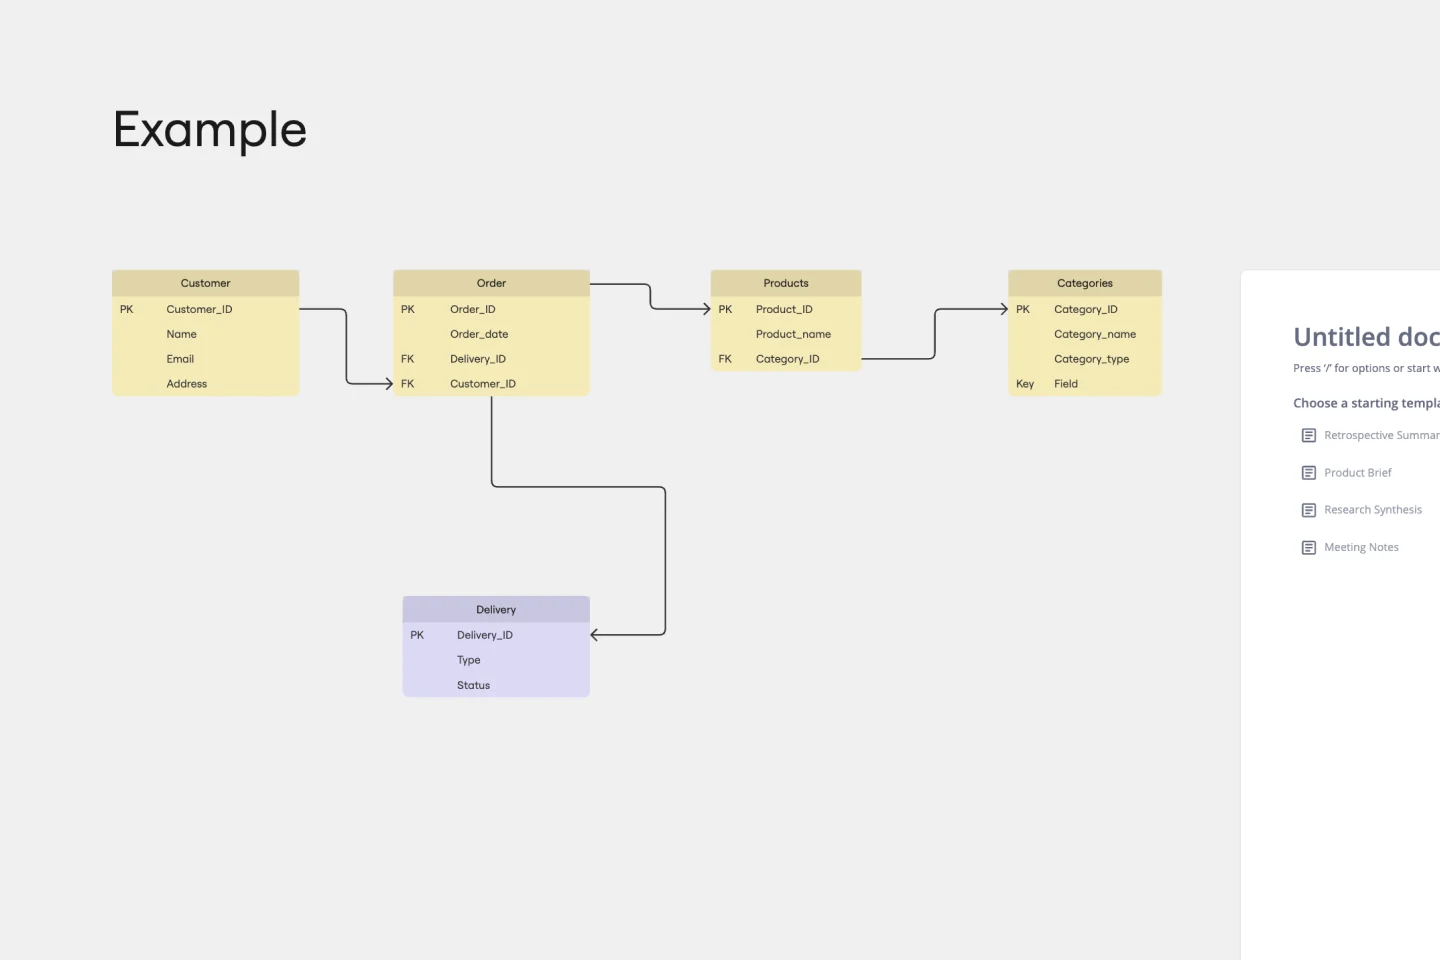
Sometimes the most important relationships in business are the internal ones—between the teams, entities, and actors within a system. An entity relationship diagram (ERD) is a structural diagram that will help you visualize and understand the many complex connections between different roles. When will an ERD come in handy? It’s a great tool to have for educating and onboarding new employees or members of a team, and our template makes it so easy to customize according to your unique needs.
Customer Journey Mapping Template Pack
Works best for:
Mapping, User Experience, Workshops
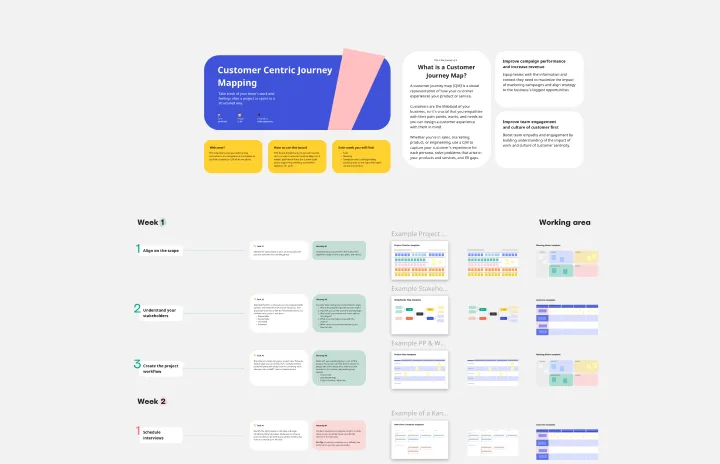
A customer journey map (CJM) is a visual representation of your customer’s experience. It allows you to capture the path that a customer follows when they buy a product, sign up for a service, or otherwise interact with your site. Most maps include a specific persona, outlines their customer experience from beginning to end, and captures the potential emotional highs and lows of interacting with the product or service. Use this template to easily create customer journey maps for projects of all kinds.
UML Communication Diagram Template
Works best for:
Software Development, Mapping, Diagrams
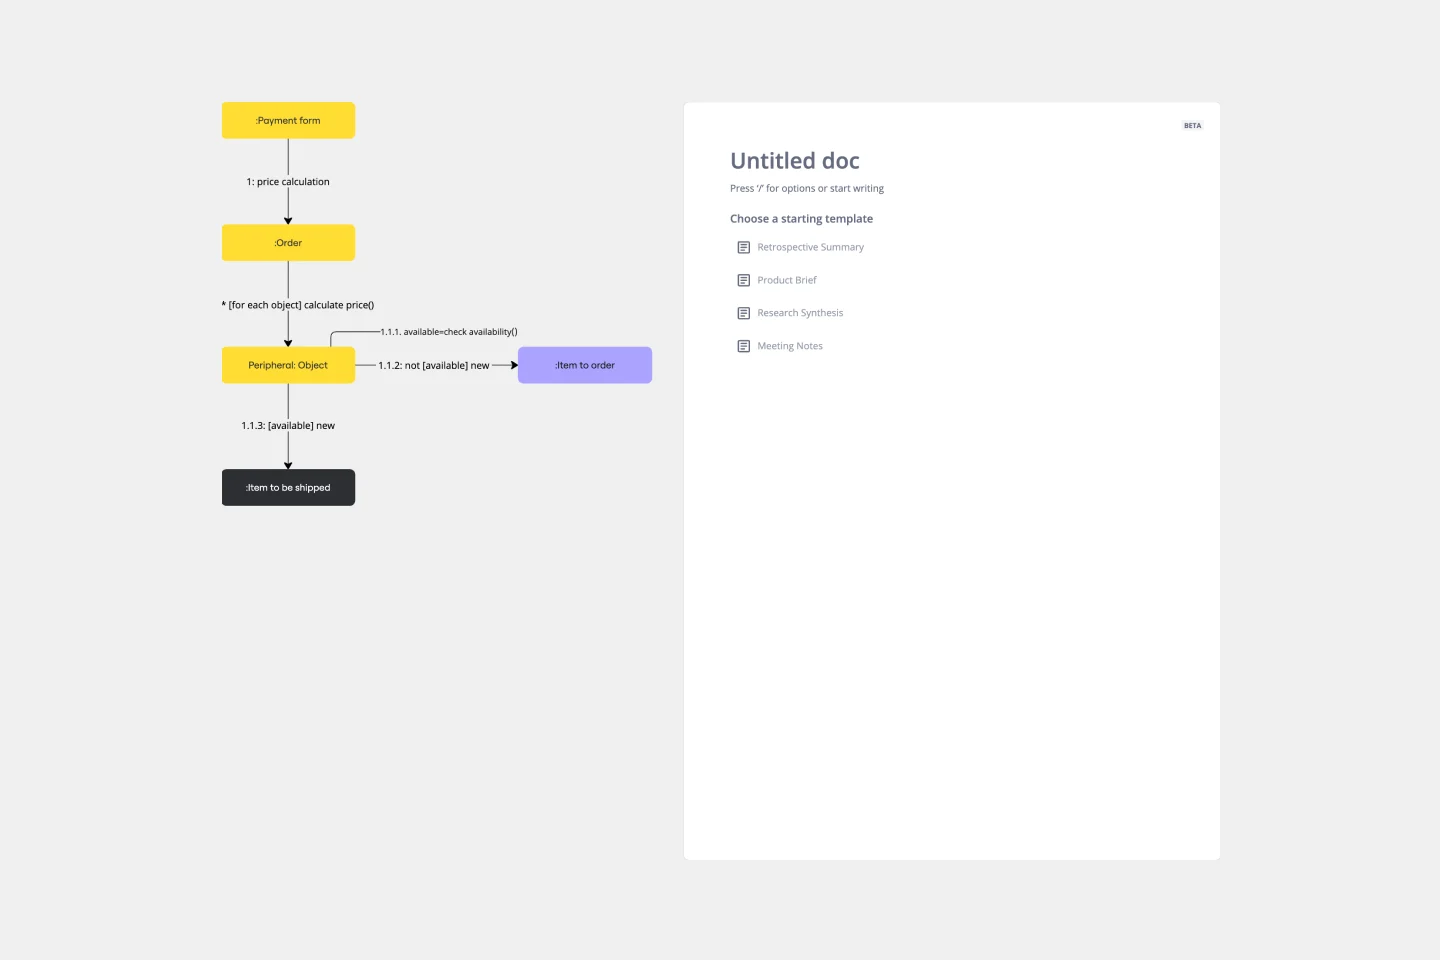
Most modern programs consist of many moving parts working to a precise set of instructions. With a communication diagram, you can visualize exactly how those parts work together, giving you a clearer understanding of your program as a whole. What’s more, the diagram leaves spaces for expanding the network of relationships as your product grows and evolves. A communication diagram is a vital tool in any software designer’s arsenal.
App Wireframe Template
Works best for:
UX Design, Wireframes
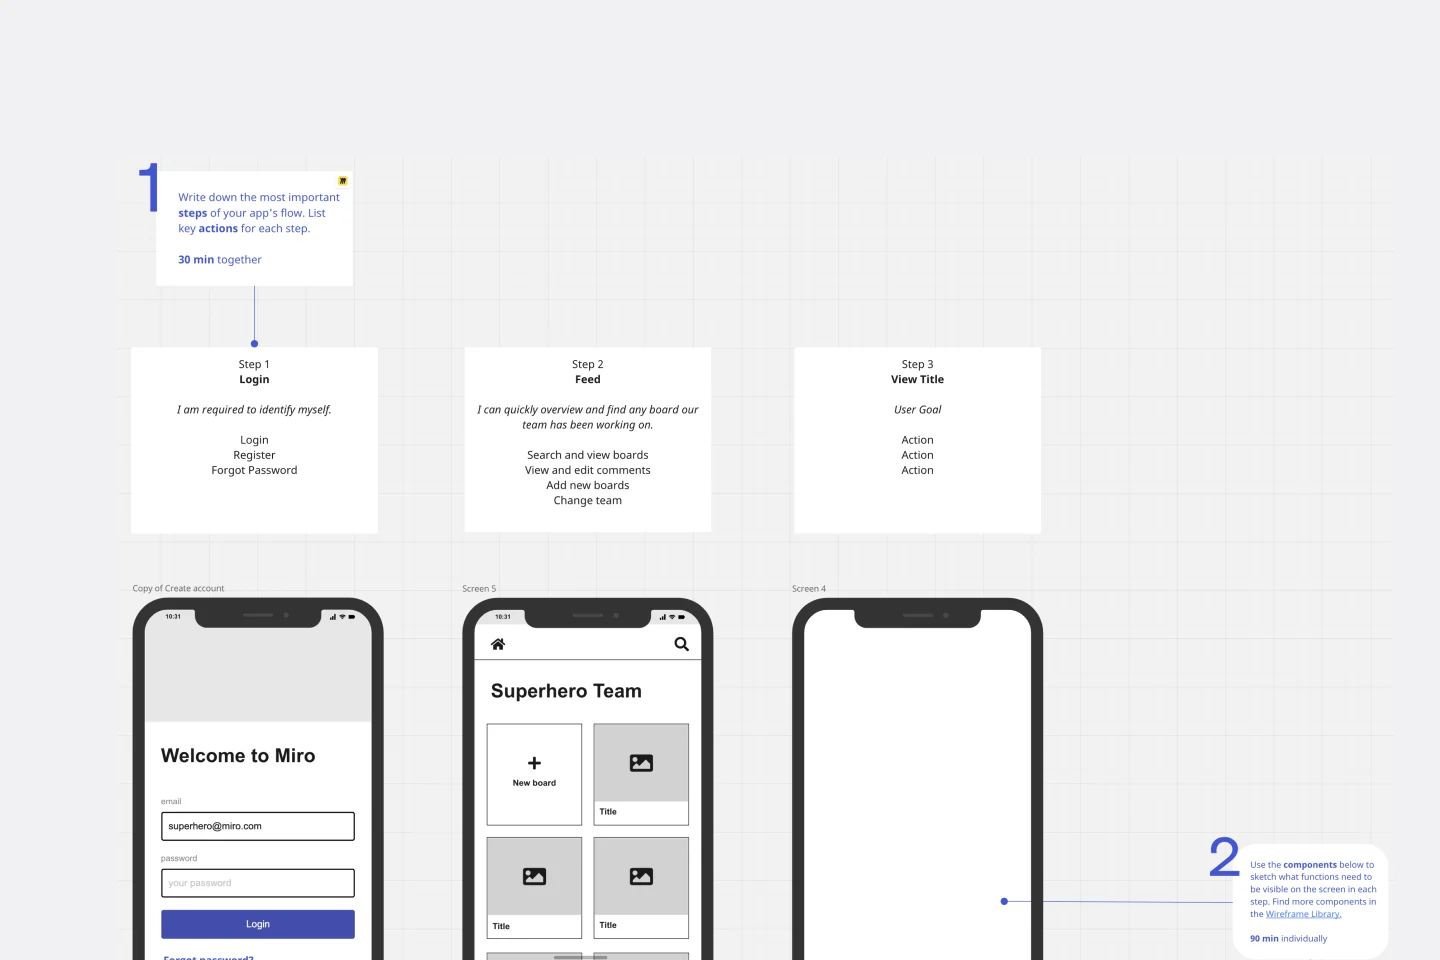
Ready to start building an app? Don’t just imagine how it will function and how users will interact with it—let a wireframe show you. Wireframing is a technique for creating a basic layout of each screen. When you wireframe, ideally early in the process, you’ll gain an understanding of what each screen will accomplish and get buy-in from important stakeholders—all before adding the design and content, which will save you time and money. And by thinking of things in terms of a user’s journey, you’ll deliver a more compelling, successful experience.