Bank Mobile App User Journey
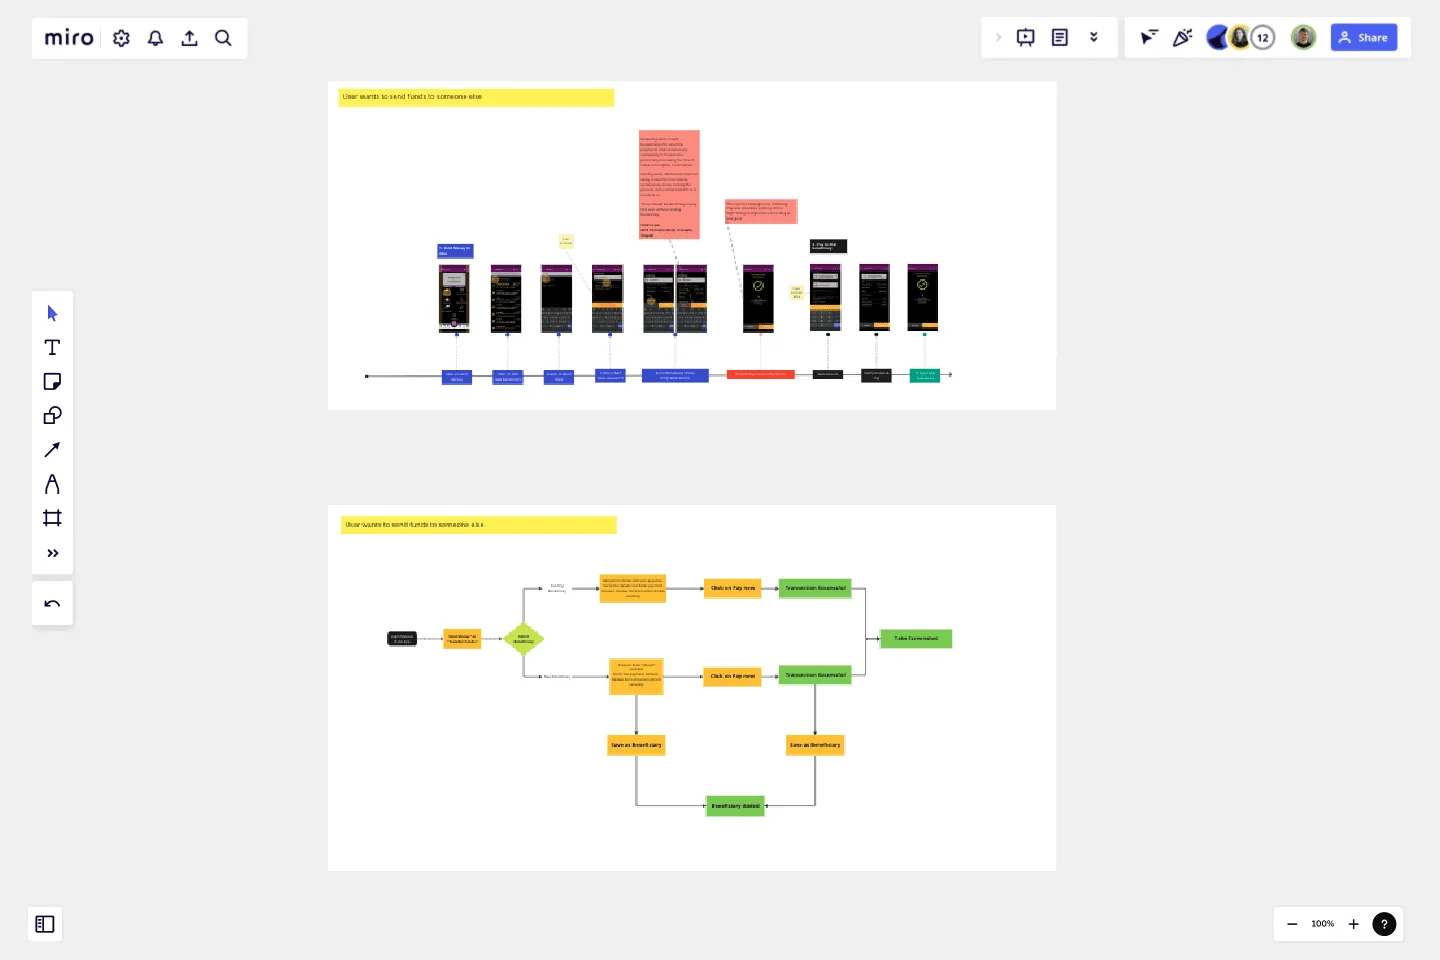
This template serves as a comprehensive visualization tool for mapping out the user journey and user flow of a product, offering a structured approach to understanding and improving the user experience.
This template follows a two-step process, beginning with the depiction of the current user journey followed by the creation of the proposed user flow.
Understanding the current user journey is an essential first step. It involves meticulously mapping out the various touchpoints, interactions, and experiences a user goes through when engaging with a product or service. By visually representing this existing journey, it becomes easier to identify pain points, bottlenecks, and areas where user satisfaction can be enhanced. This process allows stakeholders to gain a holistic perspective of the user's experience, pinpointing areas that require optimization.
Once the existing user journey is thoroughly documented, the template moves on to the proposed user flow. This step entails envisioning an improved user experience by redesigning the sequence of actions and interactions within the product. It allows for the incorporation of user-centered design principles, best practices, and innovative ideas. By creating a user flow that aligns more closely with the desired user experience, the template empowers teams to conceptualize and communicate how the product should ideally function.
The template's visual format is a valuable asset in presenting findings and recommendations to stakeholders and team members. It enhances clarity and fosters collaboration by providing a common visual language for discussing user experience improvements. It serves as a tangible reference point for ongoing discussions and decisions related to the product's development.
Moreover, the template is adaptable to various stages of product development. Whether you are starting from scratch, redesigning an existing product, or implementing incremental improvements, it can accommodate your needs. It promotes an iterative approach to design, allowing teams to revisit and refine the proposed user flow as the project progresses or user feedback is gathered.
In conclusion, this user journey and user flow template is a versatile tool that promotes a user-centric design approach. It facilitates the exploration of the current user experience landscape and guides the envisioning of an improved user flow. By utilizing this template, product teams can foster better communication, enhance collaboration, and ultimately create products that resonate with users and exceed their expectations.
This template was created by Muhammad Mohsin.
Get started with this template right now.
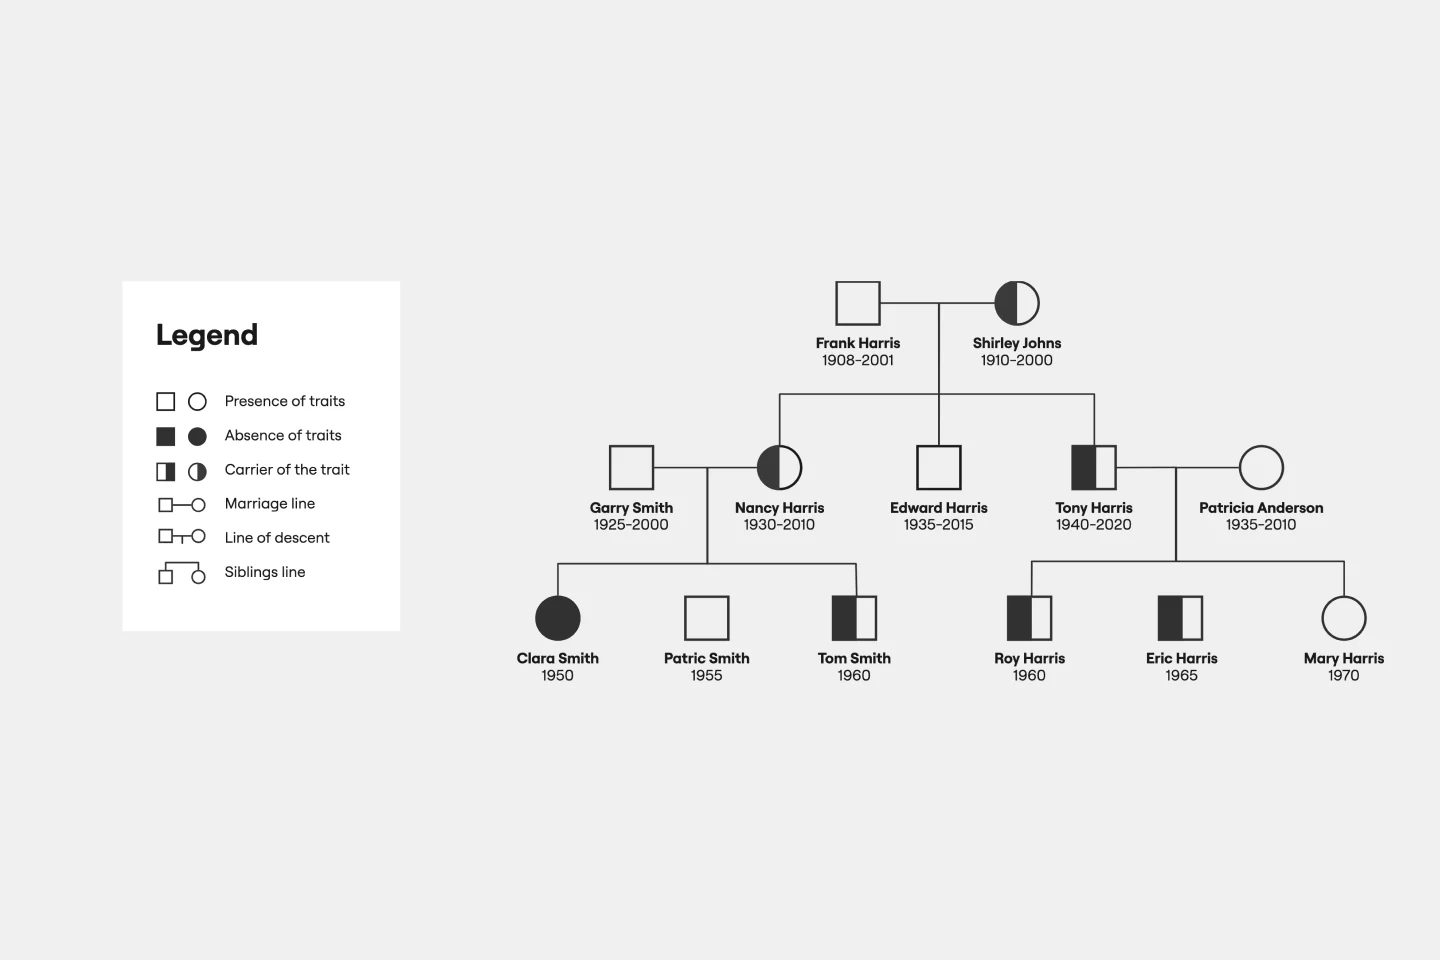
Pedigree Diagram Template
Works best for:
Education
Use our Pedigree Diagram Template to show how traits and diseases are passed from one generation to the next. Whether you’re a doctor, farmer, or just someone interested in genetics, a Pedigree Diagram can help you identify hereditary traits.
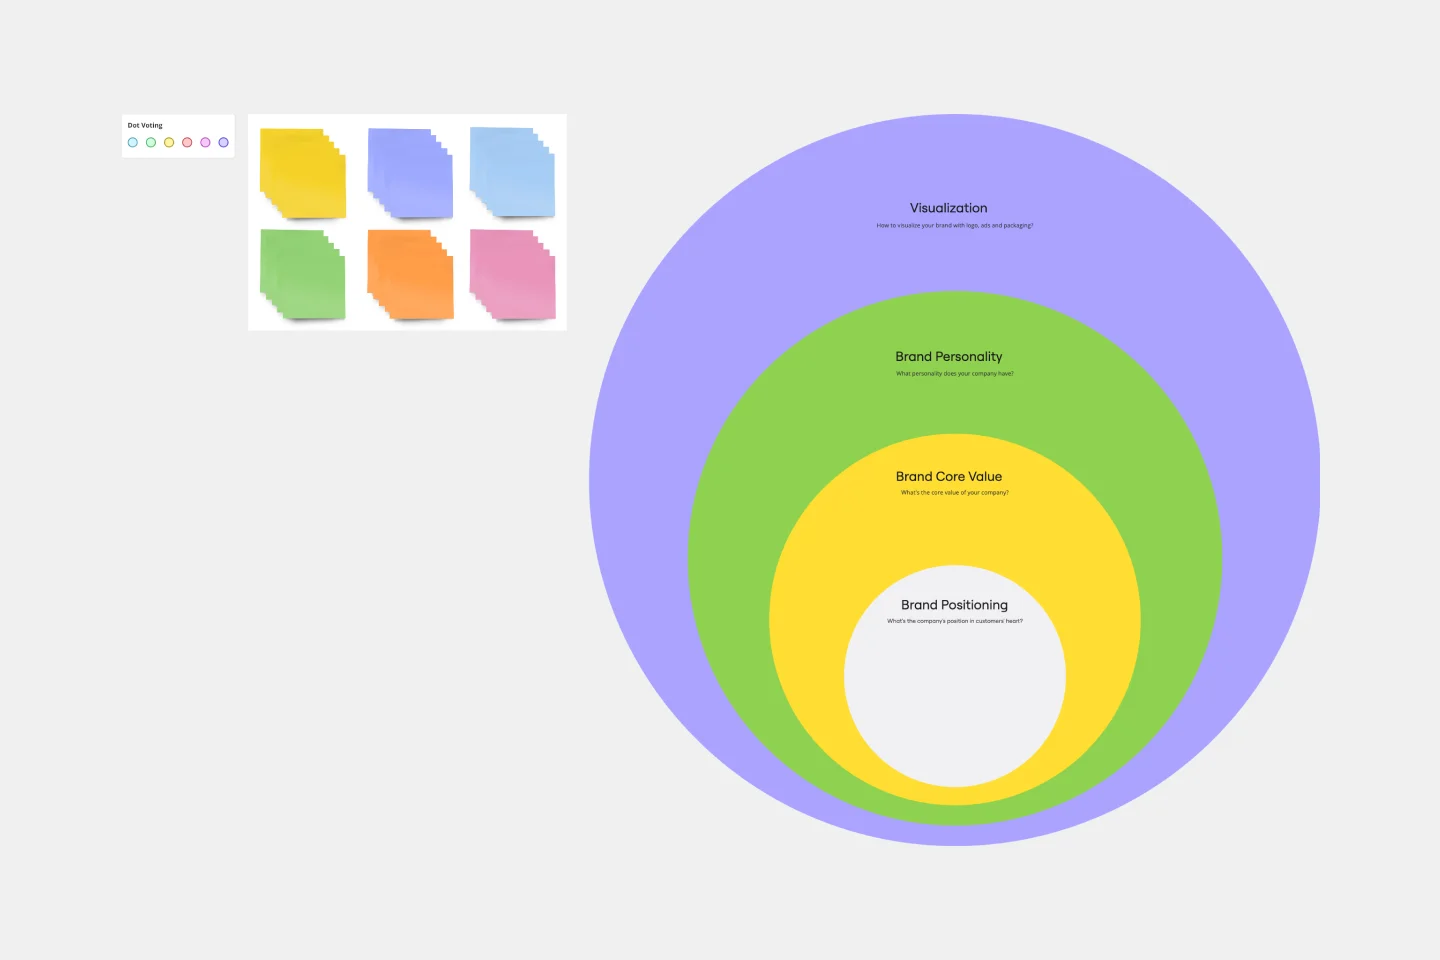
Onion Diagram Template
Works best for:
Diagramming, Mapping and Diagramming
The Onion Diagram Template is a distinct tool designed to visually represent layers of a specific concept, system, or process, akin to the layers of an onion. Each concentric layer of the diagram provides insights into a different aspect or phase of the topic at hand, moving from the core foundational element outwards to more peripheral components. One of the prime benefits of this template is its ability to offer hierarchical clarity. Users can immediately discern the importance, sequence, or interrelation of different elements within a system, facilitating enhanced comprehension and efficient decision-making.
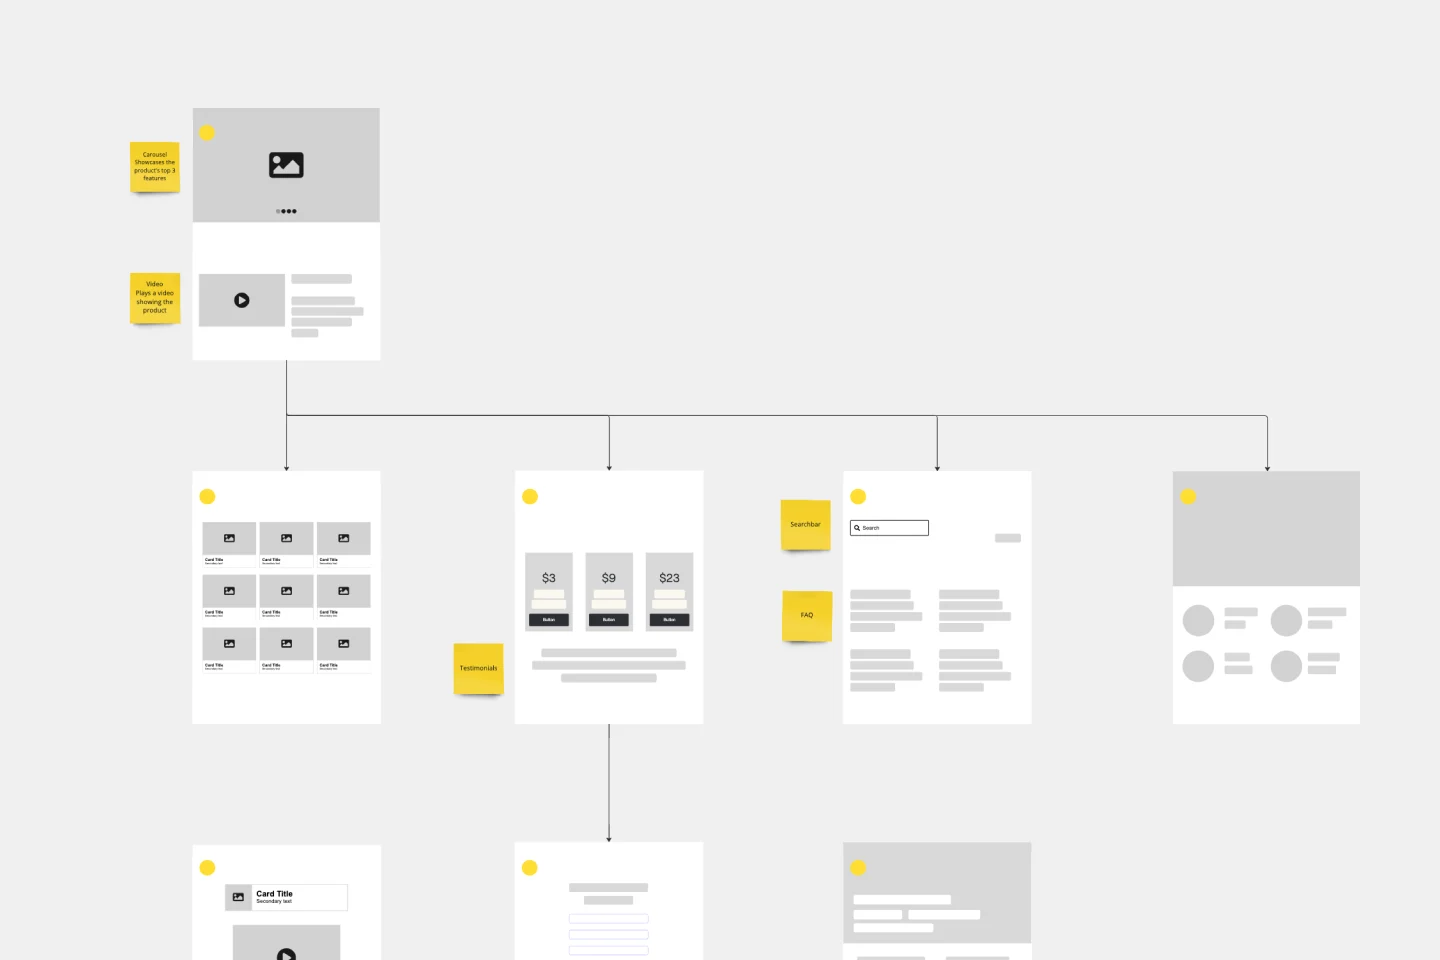
Website Flowchart Template
Works best for:
Flowcharts, Mapping, User Experience
A website flowchart, also known as a sitemap, maps out the structure and complexity of any current or future website. The flowchart can also help your team identify knowledge gaps for future content. When you’re building a website, you want to ensure that each piece of content gives users accurate research results based on keywords associated with your web content. Product, UX, and content teams can use flowcharts or sitemaps to understand everything contained in a website, and plan to add or restructure content to improve a website’s user experience.
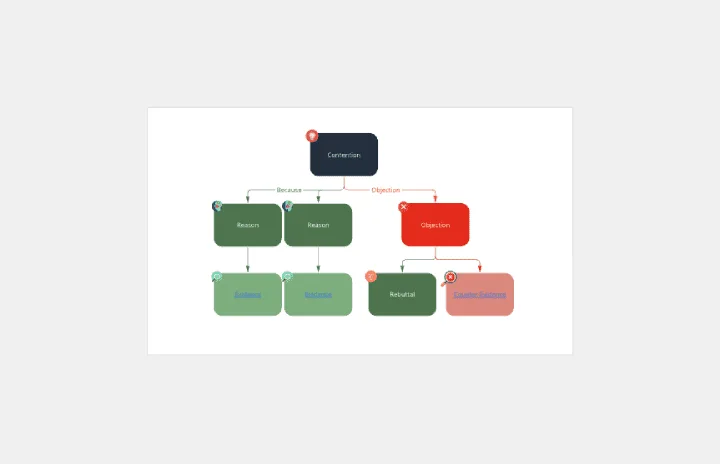
Argument Map
Works best for:
Diagramming
The Argument Map template is a visual tool for structuring and analyzing arguments and debates. It provides a structured framework for capturing premises, conclusions, and logical relationships. This template enables teams to explore complex issues, identify strengths and weaknesses in arguments, and make informed decisions. By promoting clarity and critical thinking, the Argument Map template empowers teams to navigate debates and discussions effectively, fostering consensus and understanding.
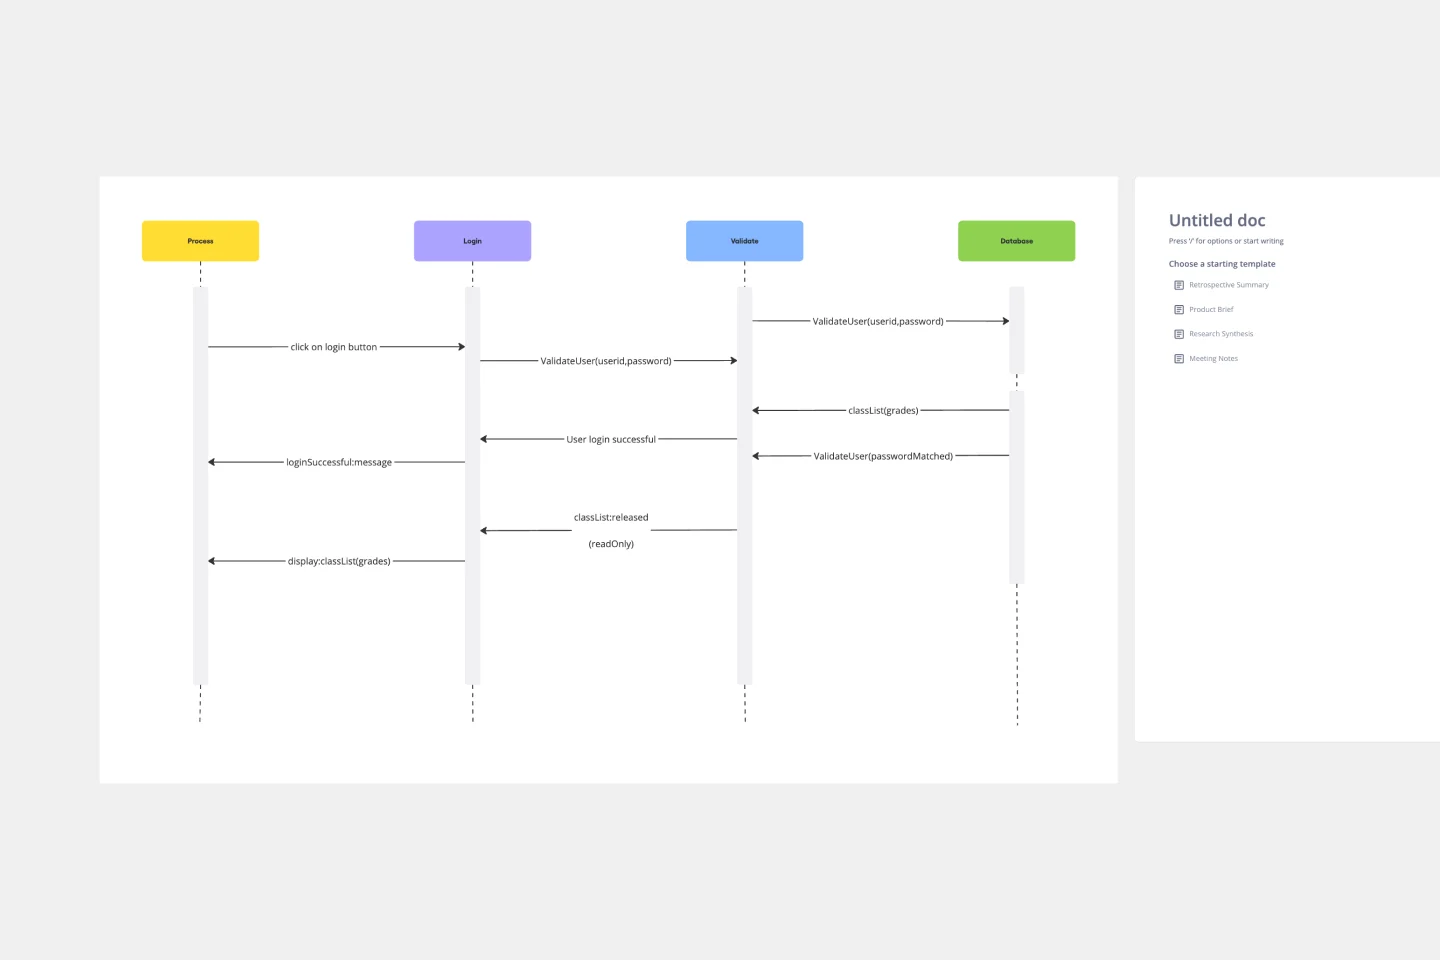
Login Sequence Diagram Template
Works best for:
Diagramming, Technical Diagramming
The UML Sequence Login Diagram Template is a valuable tool for visualizing user authentication processes. It breaks down complex login sequences into clear, visual components, facilitating collaborative understanding among team members, regardless of their technical expertise. This shared understanding is crucial for ensuring all stakeholders, from developers to project managers, are on the same page, leading to efficient decision-making and a smoother development process. The template's ability to translate technical details into an accessible format streamlines communication and significantly reduces the likelihood of misinterpretation or oversight, making it an essential asset in any software development project.
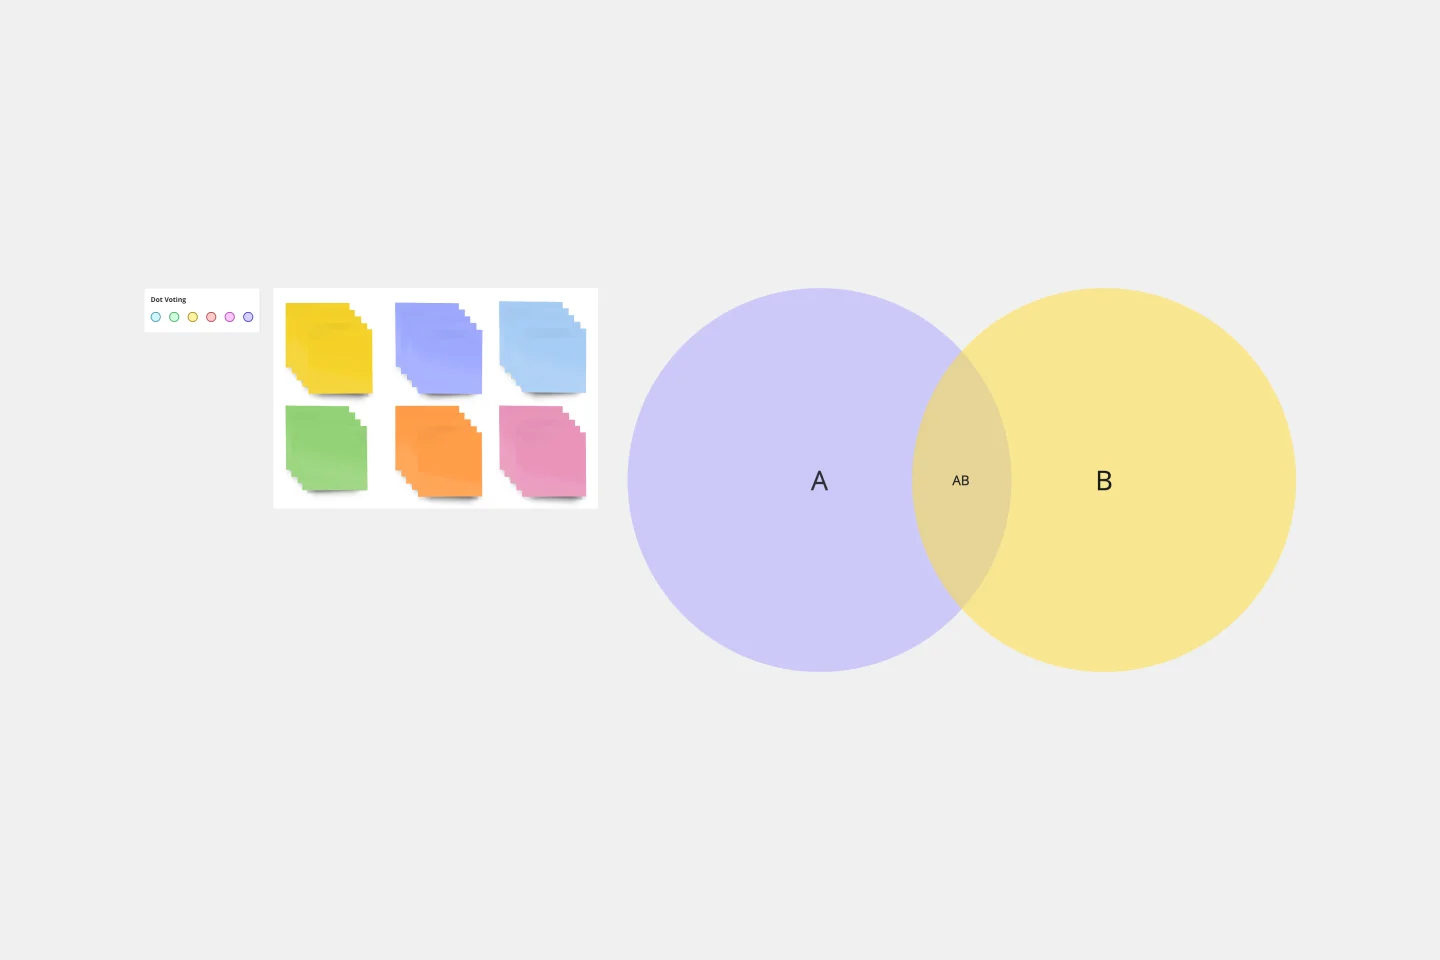
2-Circle Venn Diagram Template
The 2 Circle Venn Diagram Template is a dynamic, intuitive tool designed to represent the logical relationships between two data sets visually. For teams, this template proves valuable in enabling efficient collaboration, clear communication, and shared understanding.