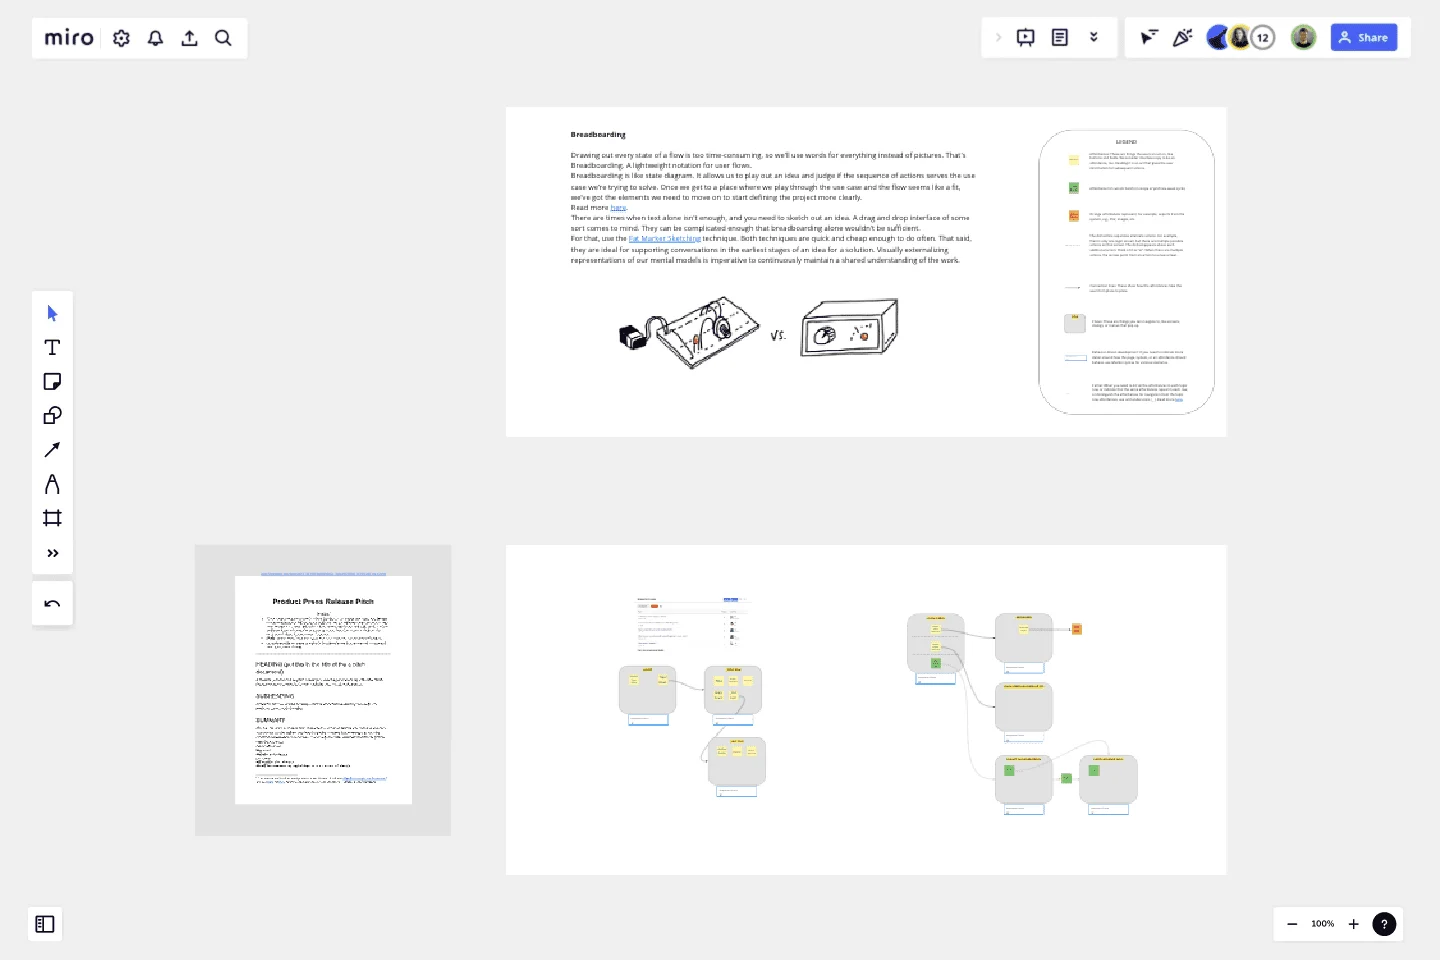
Breadboard (UI Flow Diagram)
Drawing out every state of a flow is too time-consuming, so we’ll use words for everything instead of pictures. That's Breadboarding. A lightweight notation for user flows.
Breadboarding is like state diagram. It allows us to play out an idea and judge if the sequence of actions serves the use case we’re trying to solve. Once we get to a place where we play through the use case and the flow seems like a fit, we’ve got the elements we need to move on to start defining the project more clearly.
There are times when text alone isn't enough, and you need to sketch out an idea. A drag and drop interface of some sort comes to mind. They can be complicated enough that breadboarding alone wouldn't be sufficient.
For that, use the Fat Marker Sketching technique. Both techniques are quick and cheap enough to do often. That said, they are ideal for supporting conversations in the earliest stages of an idea for a solution. Visually externalizing representations of our mental models is imperative to continuously maintain a shared understanding of the work.
This template was created by Matt Lane.
Get started with this template right now.
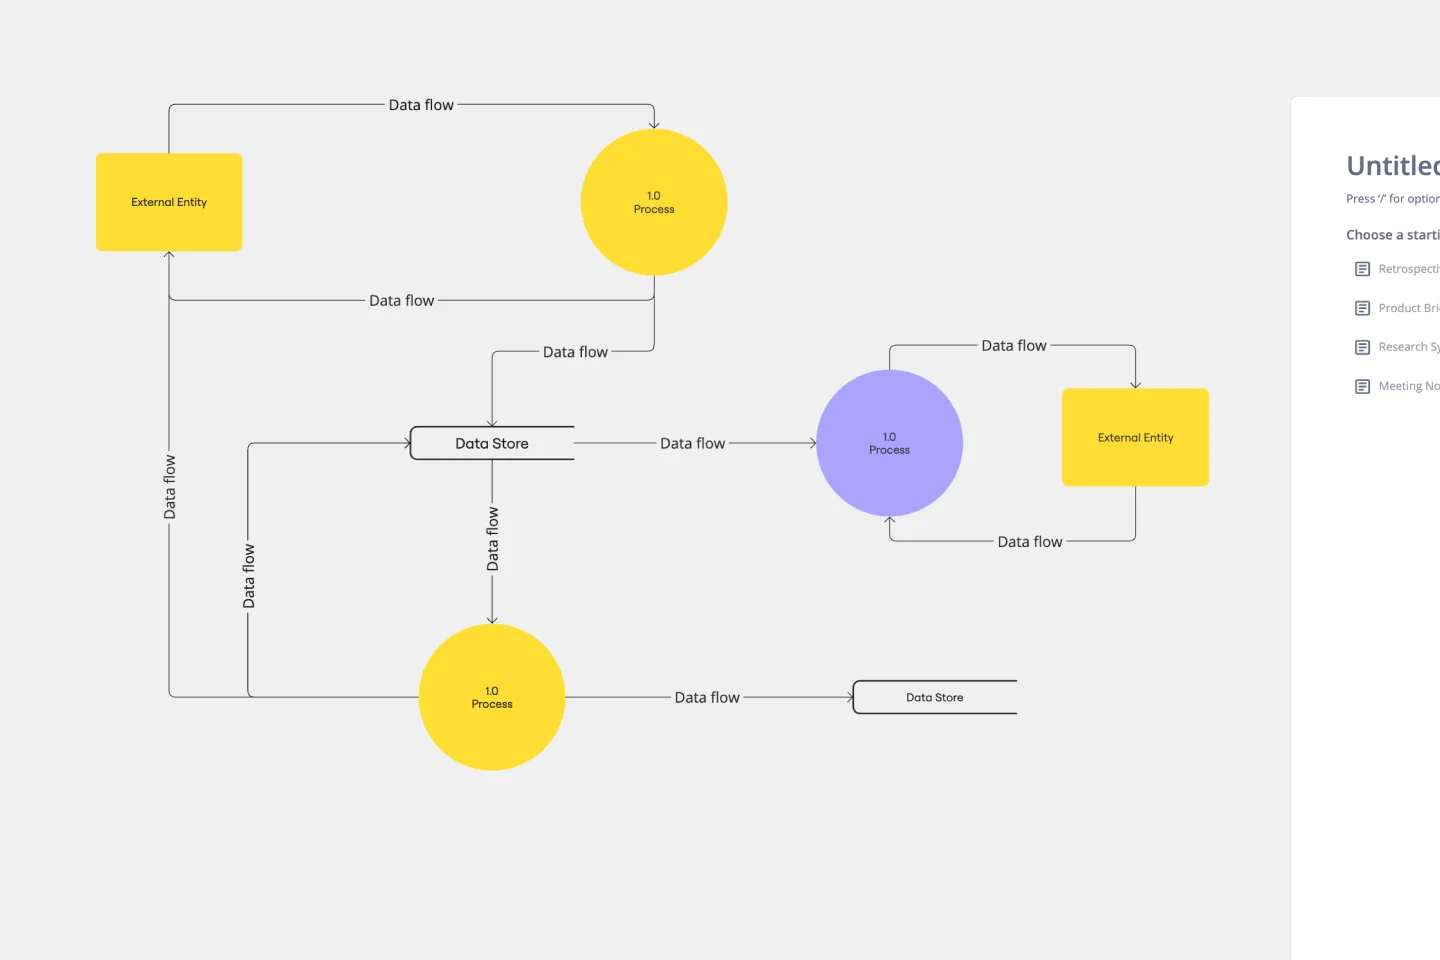
Data Flow Diagram Template
Works best for:
Flowcharts, Software Development, Diagrams
Any process can get pretty complex, especially when it has multiple components. Get a better grasp of your process through a data flow diagram (DFD). DFDs create a simple visual representation of all components in the flow of data and requirements in an entire system. They’re most often used by growth teams, data analysts, and product teams, and they’re created with one of three levels of complexity—0, 1, or 2. This template will help you easily build the best DFD for your process.
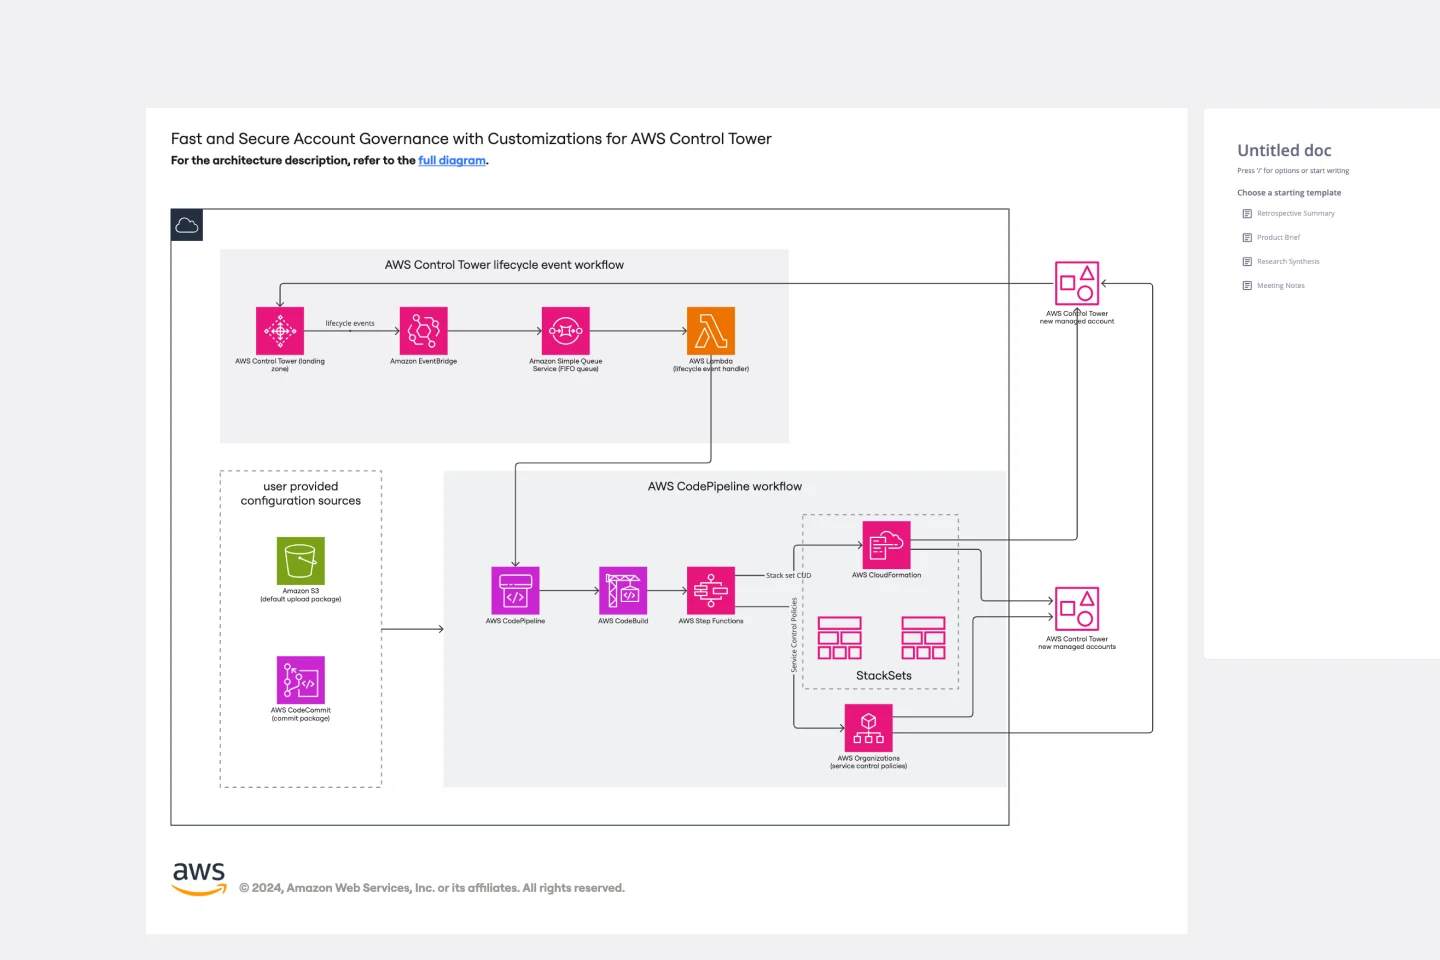
AWS Control Tower Account Governance Template
Works best for:
AWS
The AWS Control Tower Account Governance Template streamlines the setup and management of governance across multiple AWS accounts. It leverages AWS Control Tower to automate and simplify the governance process, ensuring that your AWS environment adheres to best practices for security, operations, and compliance. This template is highly customizable, allowing you to adjust governance controls and policies to meet the unique requirements of your organization. It provides a centralized view of your AWS environment, enhancing visibility and control, and scales with your organization as it grows.
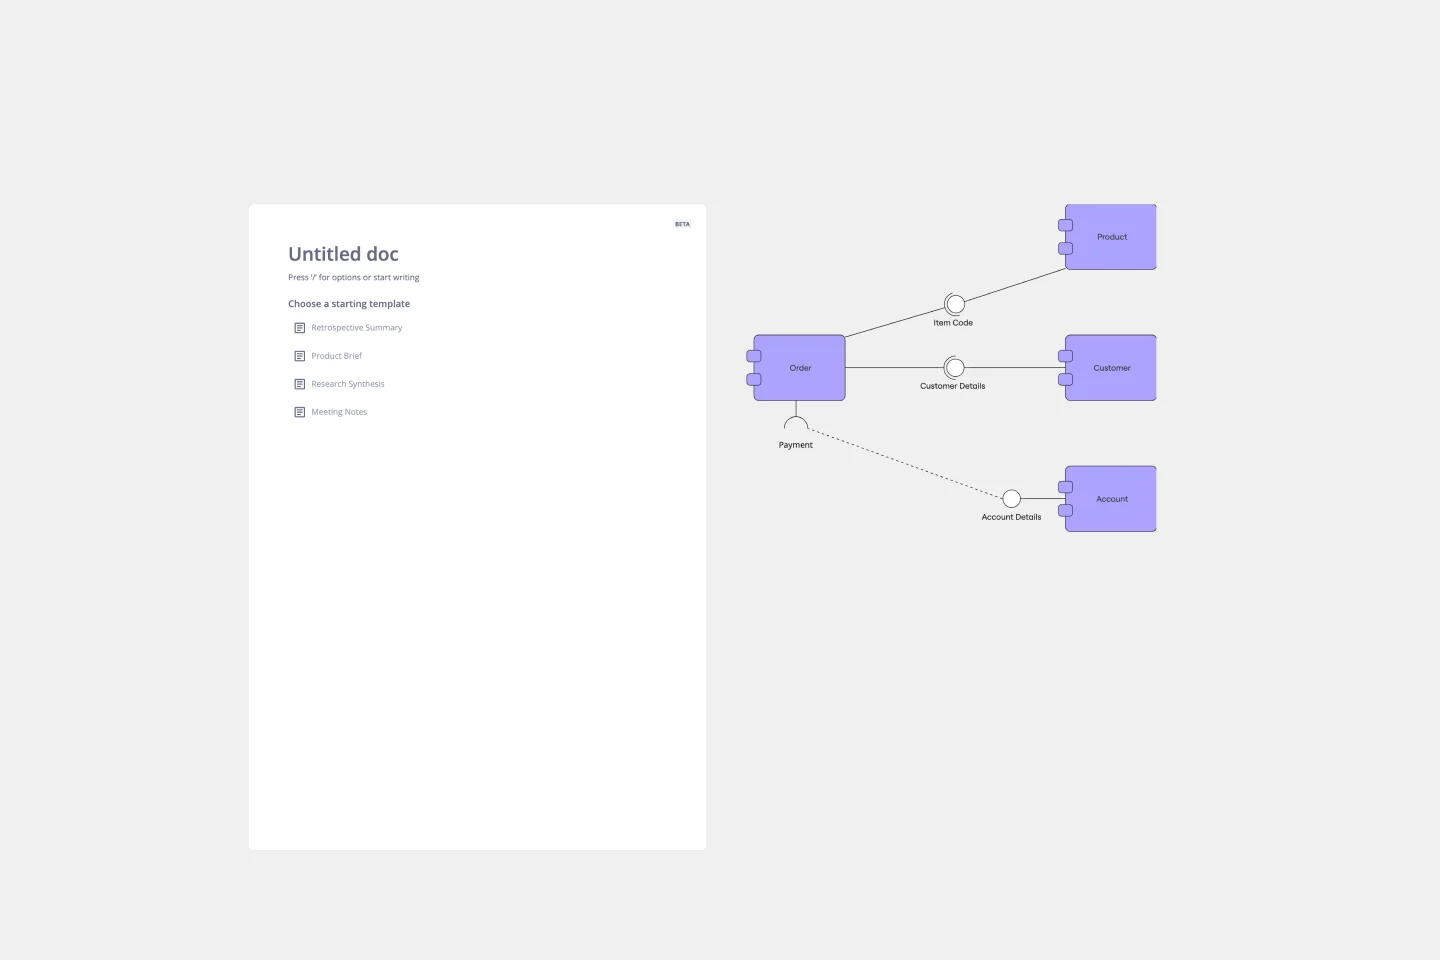
UML Component Diagram Template
Works best for:
Mapping, Diagrams, Software Development
Use our Component Diagram template to show how a system’s physical components are organized and wired together. Visualize implementation details, make sure planned development matches system needs, and more — all in a collaborative environment.
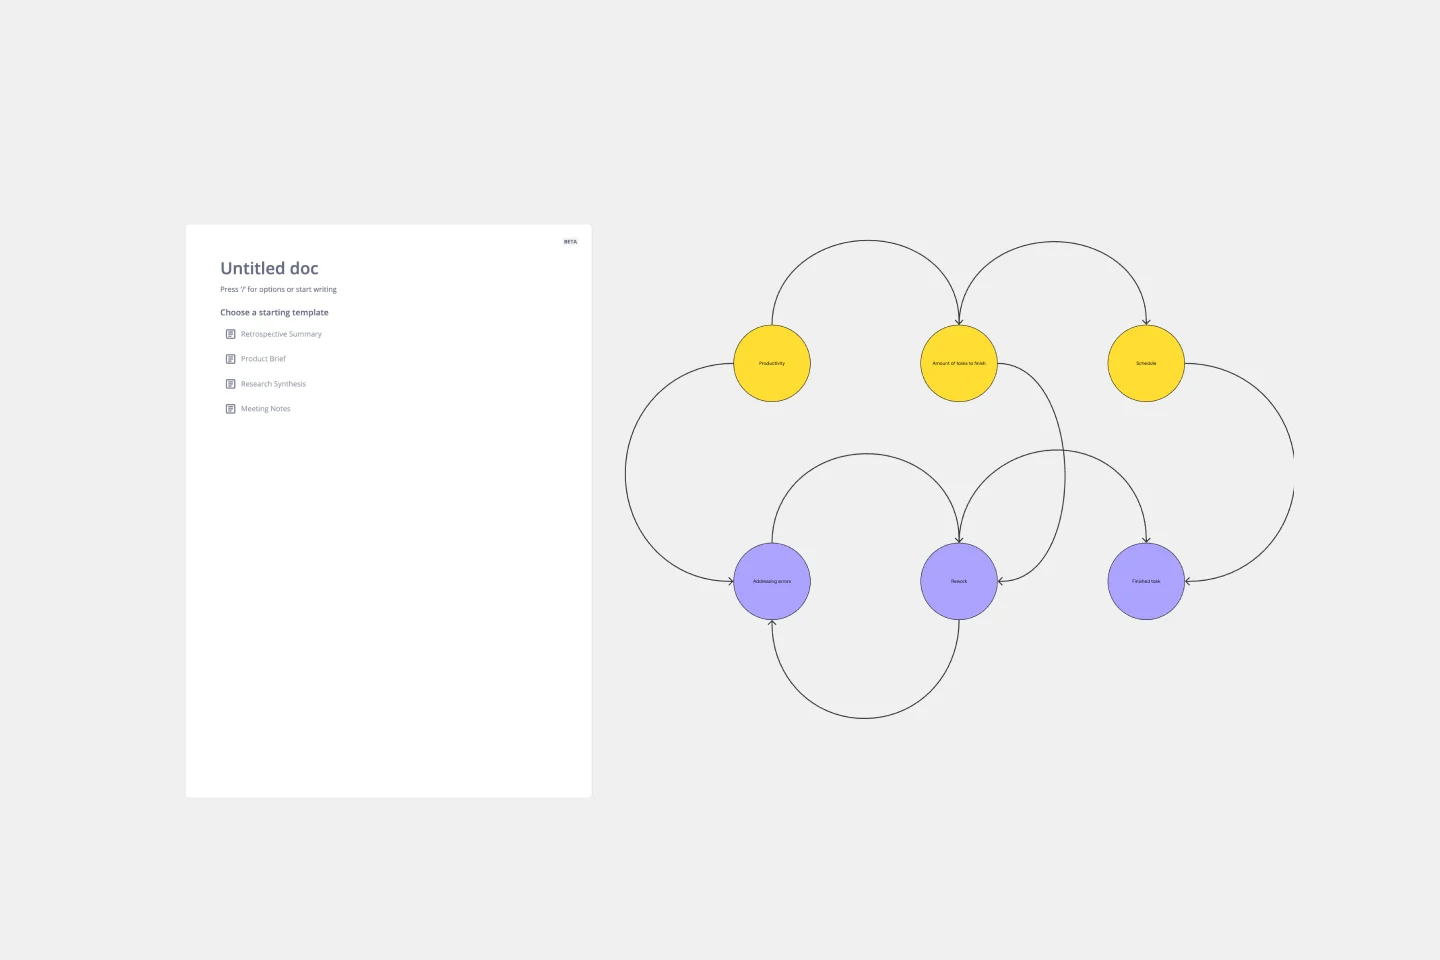
Causal Loop Diagram Template
Works best for:
Diagramming
The Causal Loop Diagram Template offers a structured framework to visualize the intricate interconnections within any system. Its standout benefit is the ability to provide a holistic perspective, ensuring that users don't just see isolated issues but understand the entire web of relationships, ultimately leading to more informed and strategic decision-making.
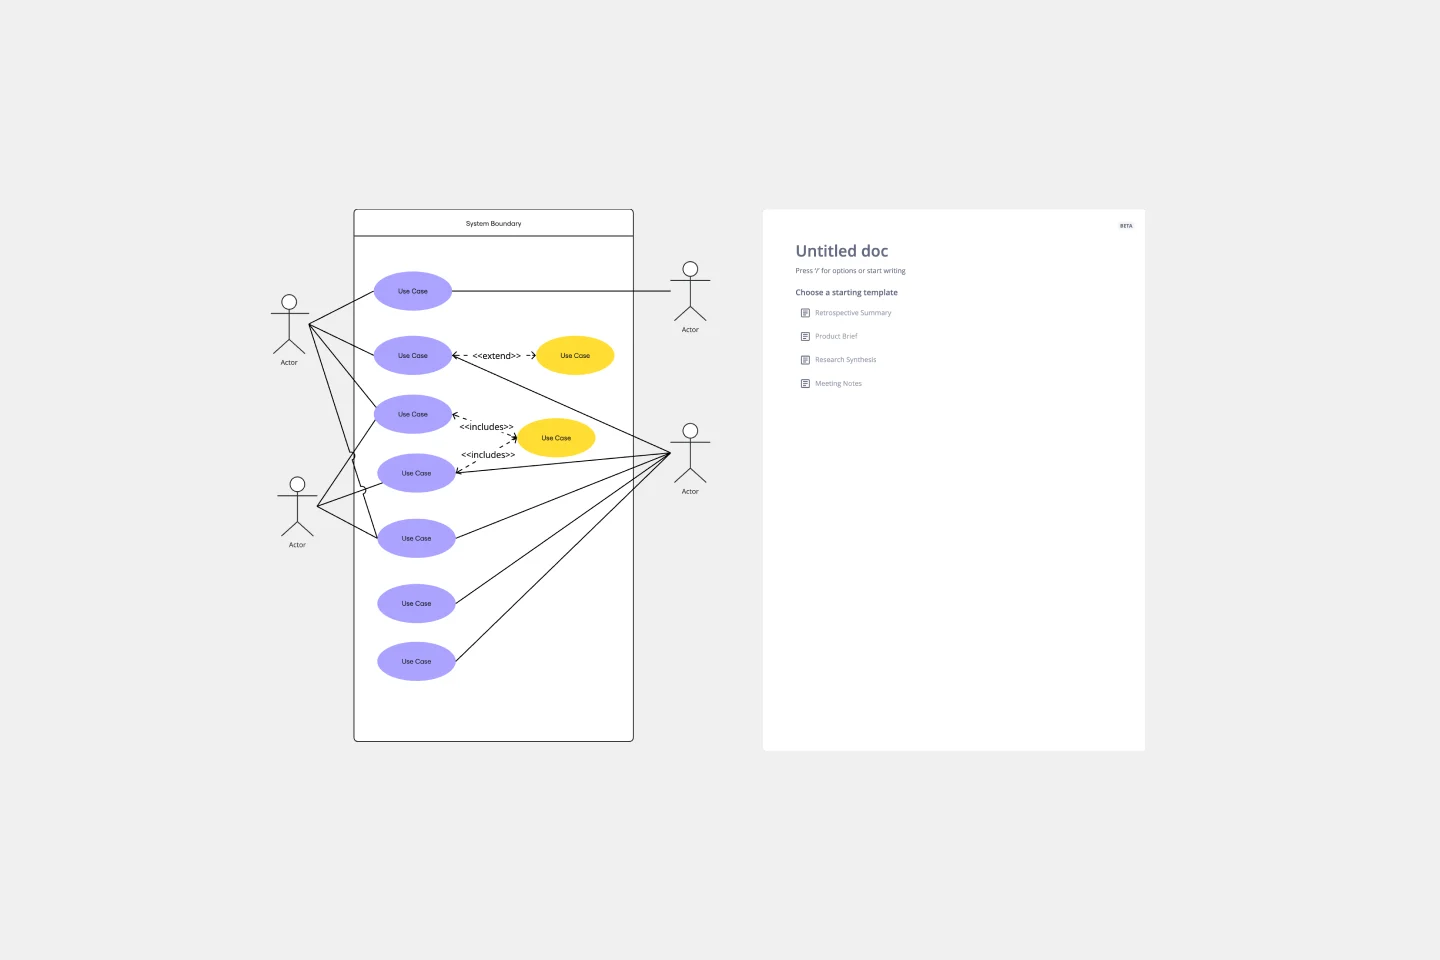
Use Case Diagram Template
Works best for:
Marketing, Market Research, Diagrams
A use case diagram is a visual tool that helps you analyze the relationships between personas and use cases. Use case diagrams typically depict the expected behavior of the system: what will happen and when. A use case diagram is helpful because it allows you to design a system from the perspective of the end user. It’s a valuable tool for communicating your desired system behavior in the language of the user, by specifying all externally visible system behavior.
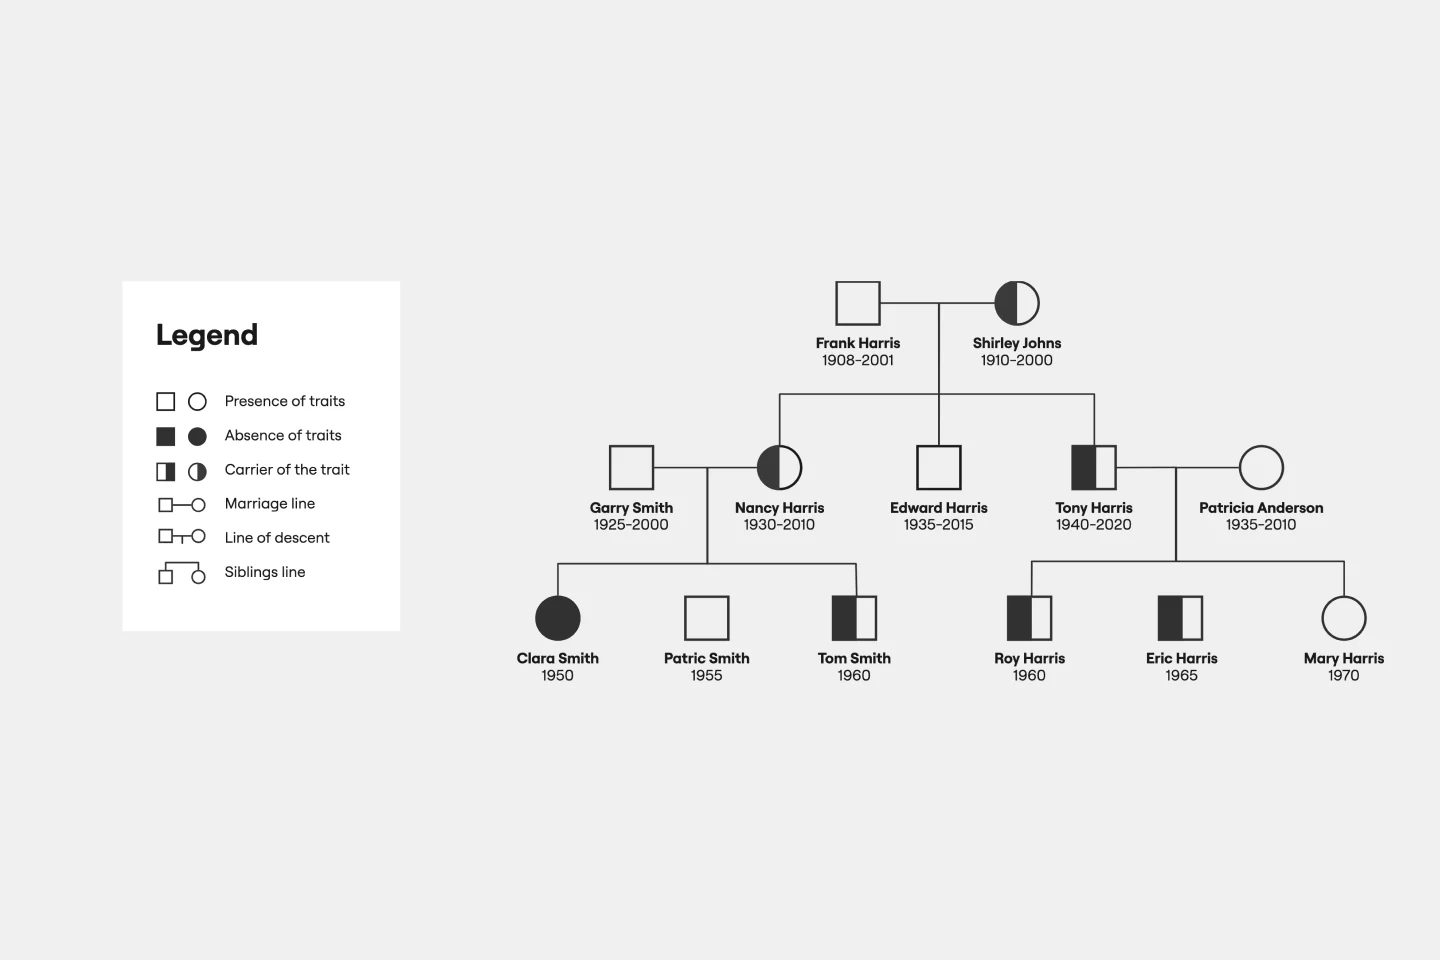
Pedigree Diagram Template
Works best for:
Education
Use our Pedigree Diagram Template to show how traits and diseases are passed from one generation to the next. Whether you’re a doctor, farmer, or just someone interested in genetics, a Pedigree Diagram can help you identify hereditary traits.