Challenge - UML Iphone
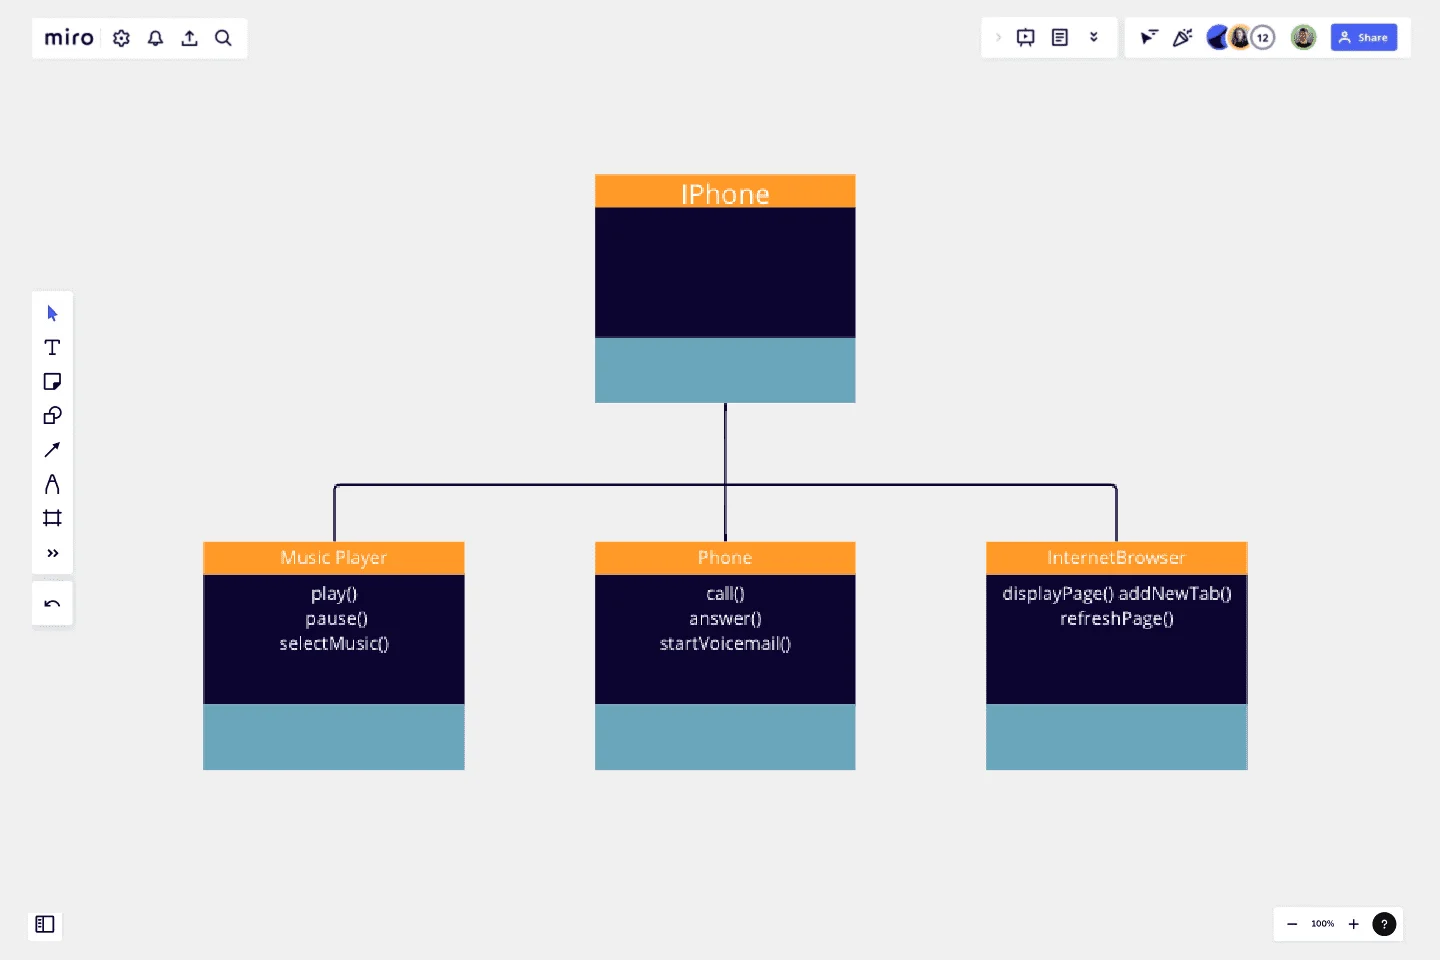
This UML diagram and corresponding Java code represent an iPhone with three main functionalities: a Music Player, a Phone, and an Internet Browser.
The UML diagram consists of three classes, each representing a distinct role of the iPhone. The MusicPlayer class has methods to play, pause, and select music. The Phone class has methods to make a call, answer a call, and start voicemail. The InternetBrowser class has methods to display a webpage, add a new tab, and refresh the page.
The Java code further elaborates on these roles by defining three interfaces: MusicPlayer, Phone, and InternetBrowser. Each interface declares the methods that correspond to the actions each role can perform.
The iPhone class implements all three interfaces, indicating that an iPhone can perform all the actions defined in these interfaces. The actual implementation of these methods is left blank, as it would depend on the specific behavior you want to achieve.
This representation is a simple yet effective way to model the diverse functionalities of an iPhone using object-oriented programming principles. It provides a clear and organized structure for understanding and implementing the various roles an iPhone can play.
This template was created by Arthur Brandi.
Get started with this template right now.
Onion Diagram Template
Works best for:
Diagramming, Mapping and Diagramming
The Onion Diagram Template is a distinct tool designed to visually represent layers of a specific concept, system, or process, akin to the layers of an onion. Each concentric layer of the diagram provides insights into a different aspect or phase of the topic at hand, moving from the core foundational element outwards to more peripheral components. One of the prime benefits of this template is its ability to offer hierarchical clarity. Users can immediately discern the importance, sequence, or interrelation of different elements within a system, facilitating enhanced comprehension and efficient decision-making.
UML ERD Diagram
Works best for:
Diagramming, UML Diagram
This template contains a few Entity-Relationship diagrams that you can re-use for your own work.
Interactive Video Storyboard Canvas
Works best for:
Diagramming
The Interactive Video Storyboard Canvas template offers a visual framework for planning and storyboarding interactive video content. It provides elements for outlining scenes, defining interactions, and visualizing user pathways. This template enables teams to design engaging and immersive video experiences, facilitating collaboration and alignment among content creators and stakeholders. By promoting creativity and interactivity, the Interactive Video Storyboard Canvas empowers teams to create compelling video narratives that captivate audiences and drive engagement.
Context Diagram Template
Works best for:
Business Management, Mapping, Diagrams
A context diagram is a perfect tool to view an entire system as a single process and understand how external factors interact with it. These external factors can include customers, developers, management, and more. The Context Diagram Template is your tool for creating this diagram.
Double Bubble Map Template
Works best for:
Diagramming, Mapping, Brainstorming
Double Bubble Map Template serves as a powerful tool to facilitate teamwork and streamline idea exploration. This adaptable template empowers teams to brainstorm, analyze, and compare concepts with ease, making it an invaluable asset for enhancing creativity and fostering clarity among team members.
VRIO Analysis Template
Works best for:
Diagramming, Strategy
The VRIO Analysis Template is a framework that helps businesses evaluate their resources and capabilities for competitive advantage. It categorizes resources into four areas: Value, Rarity, Imitability, and Organization. This provides a comprehensive view of an organization's strengths and potential weaknesses. The template has the key benefit of offering quick visual insights. Decision-makers can immediately identify and focus on resources that are valuable, rare, hard to imitate, and well-organized. This ensures a sustainable competitive edge and saves time by avoiding lengthy textual analyses.
