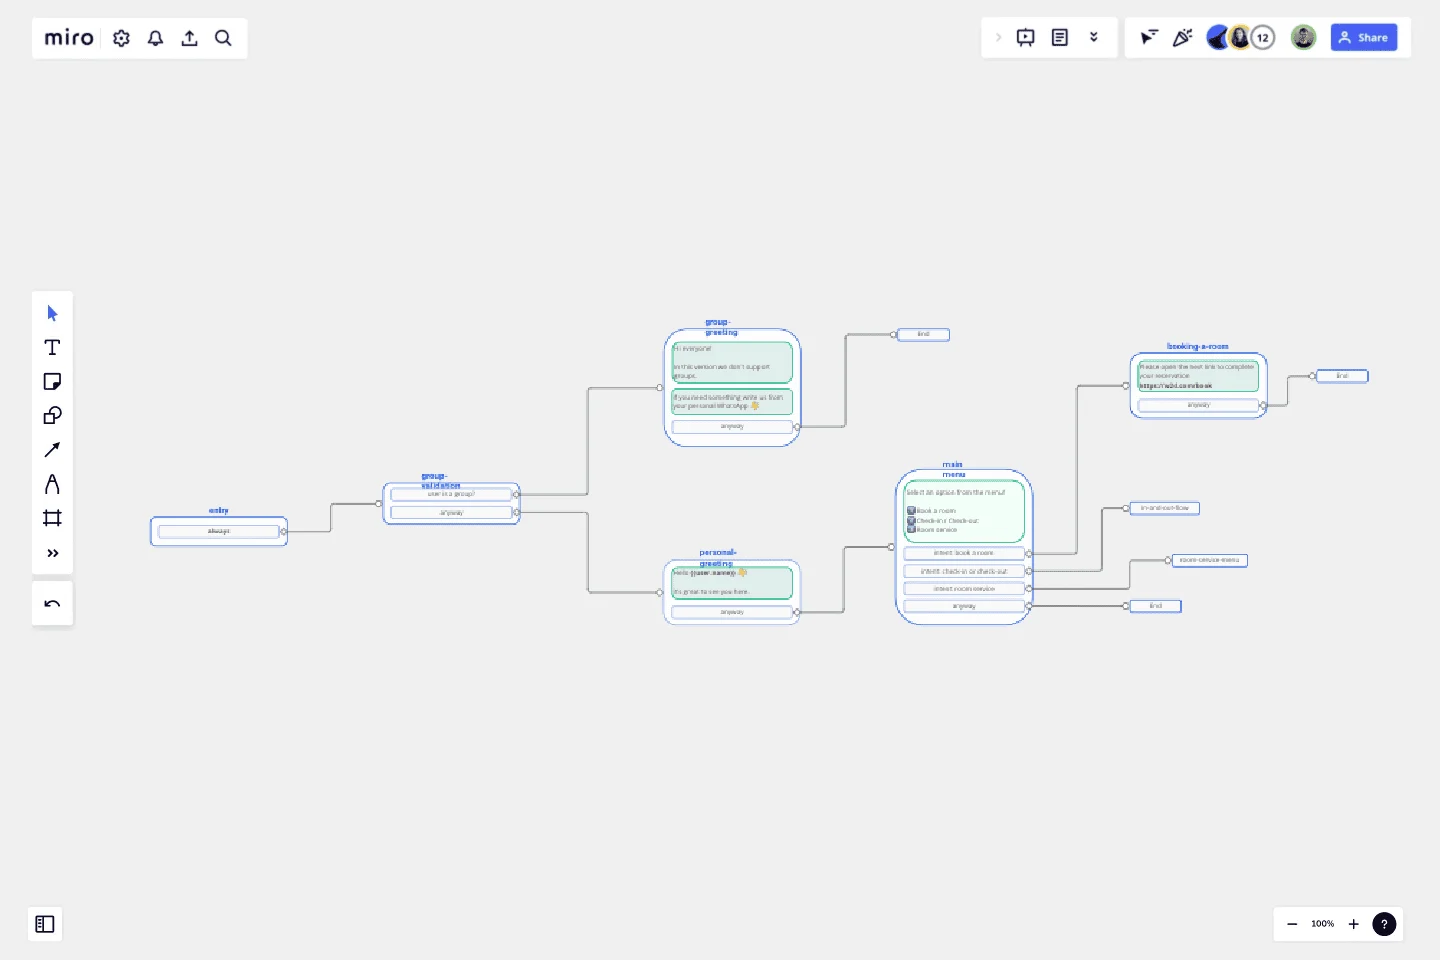
Chat-Bot
Create your own chatbot!
Here are some instructions to get you started:
Determine the purpose and scope of your chatbot: First, decide what you want your chatbot to do and what type of conversations it will have. Will it be a customer service chatbot, a personal assistant, or something else entirely? Once you have a clear idea of your chatbot's purpose, you can move on to the next step.
Design your chatbot's personality and tone: Your chatbot's personality and tone will affect how users interact with it. Decide whether you want your chatbot to be formal or casual, friendly or professional, and so on.
Create your chatbot's conversation flow: Design a conversation flow for your chatbot, outlining the various paths users can take when interacting with it. Consider what questions your chatbot will ask users and how it will respond to their answers.
Train your chatbot: Use your chosen platform to train your chatbot using natural language processing (NLP) and machine learning. This will help your chatbot understand user input and respond appropriately.
Test your chatbot: Test your chatbot with a small group of users to identify any issues or areas for improvement. Refine your chatbot's conversation flow and training as needed.
Deploy your chatbot: Once you're happy with your chatbot's performance, deploy it on your website or messaging platform. Monitor its performance and make adjustments as necessary.
That's it! By following these instructions, you should be able to create a functional chatbot that meets your needs.
Good luck!
This template was created by Kike Rios.
Get started with this template right now.
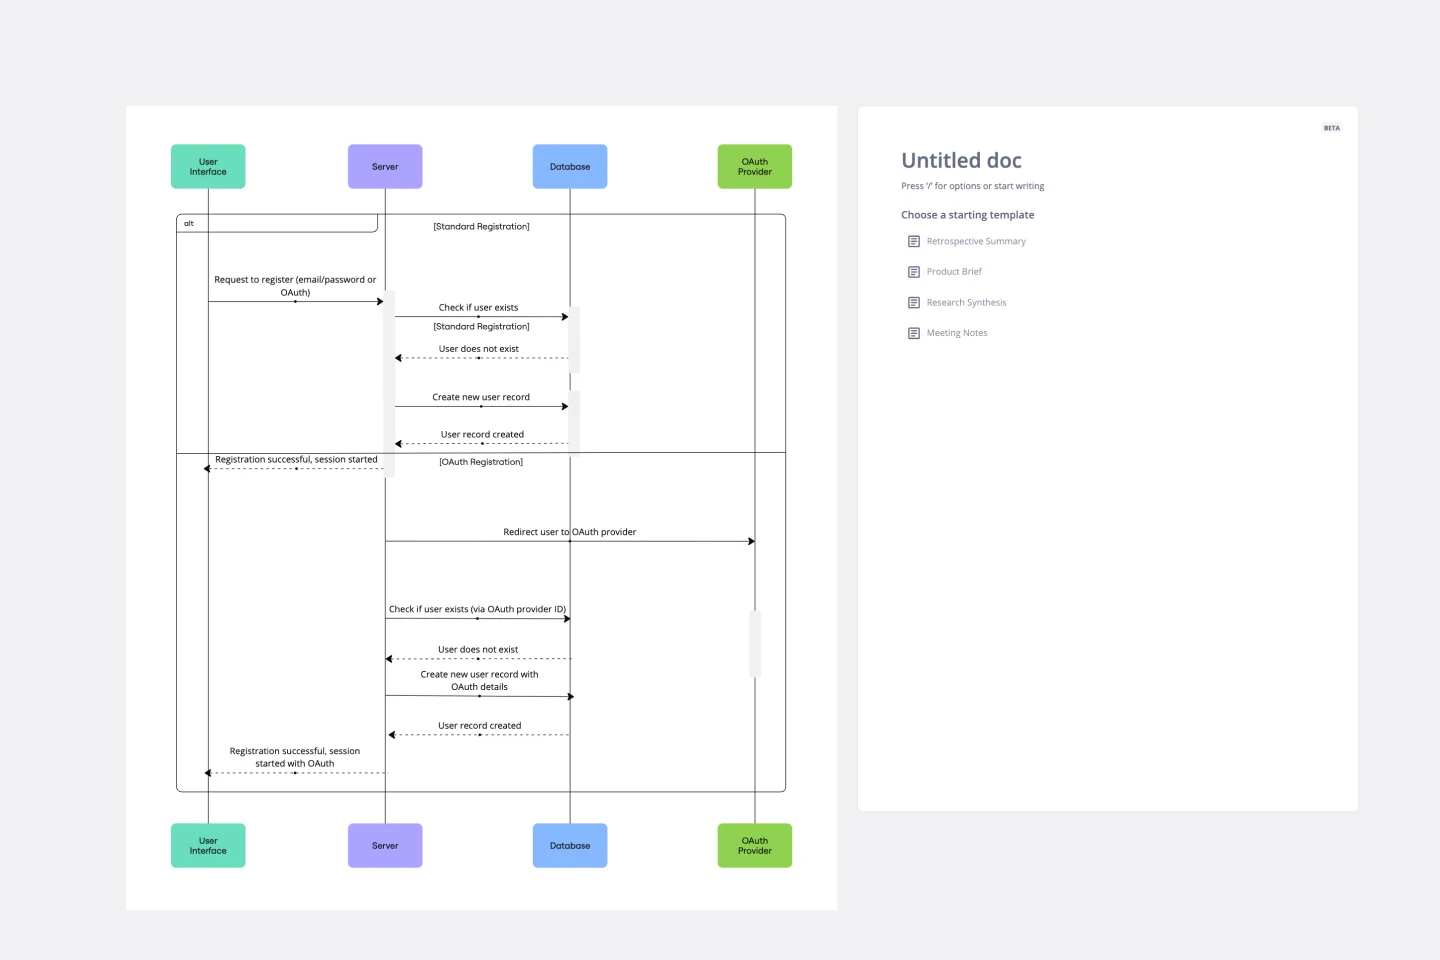
UML Sequence Registration Process Template
Works best for:
UML
The UML Sequence Registration Process Template helps visualize and document user registration processes. It enables the rapid creation of sequence diagrams, which are crucial for enhancing clarity and identifying potential issues early in the design phase. This template not only supports collaborative efforts through Miro's platform, facilitating real-time teamwork, but also ensures a comprehensive system design. Being part of a broader collection of UML diagram templates, it stands as a valuable asset for projects involving registration workflows, contributing to streamlined project execution and effective communication among team members.
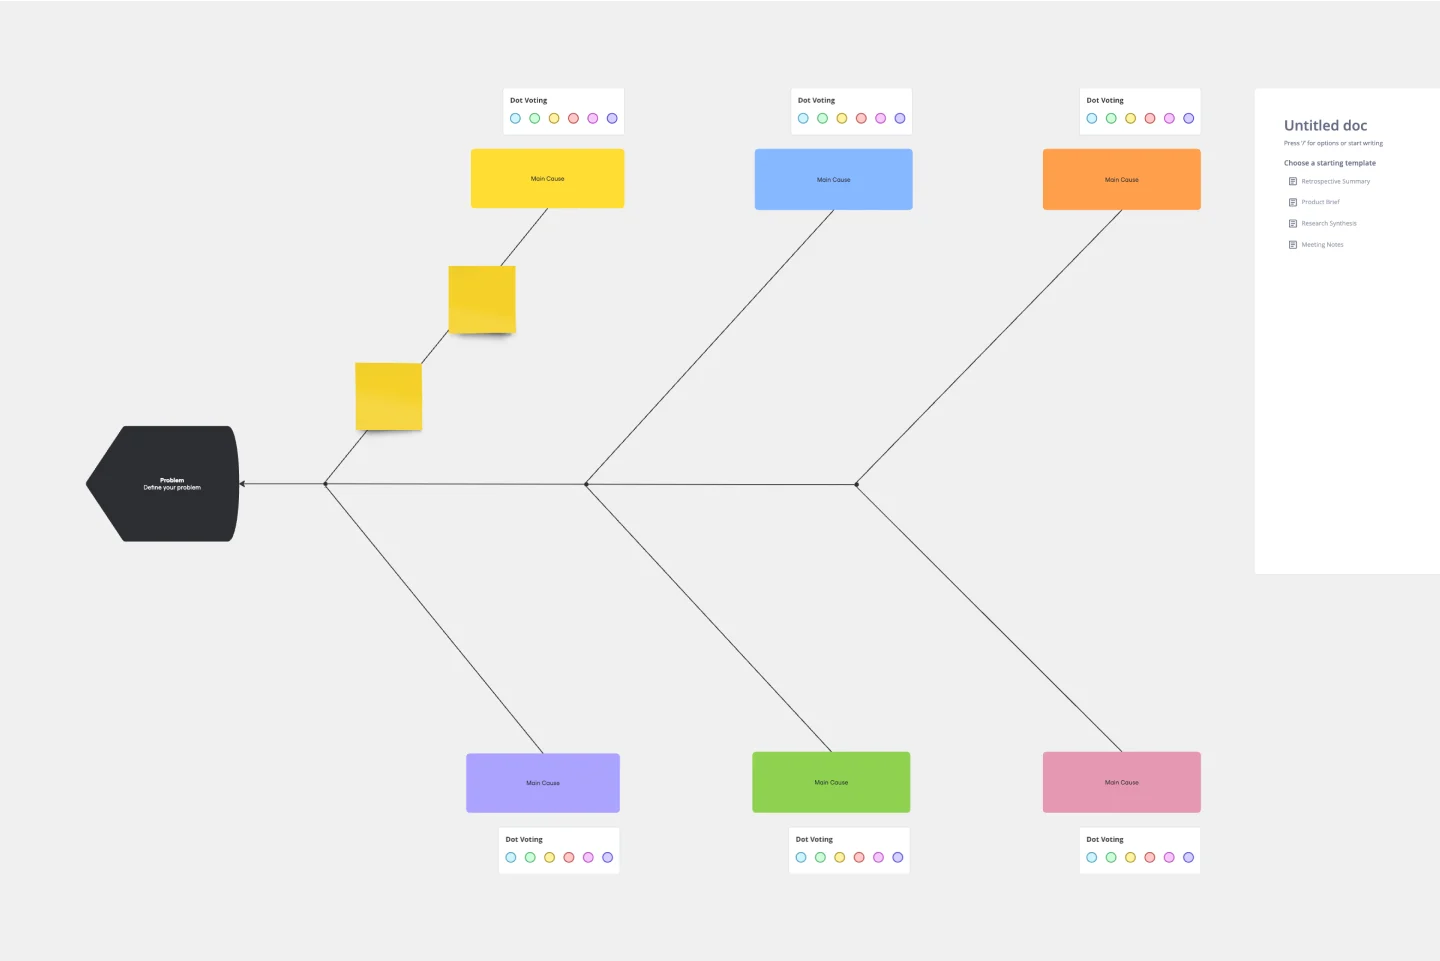
Fishbone Diagram Template
Works best for:
Operations, Diagrams, Workflows
What is the best way to solve any problem your team faces? Go straight to the root. That means identifying the root causes of the problem, and fishbone diagrams are designed to help you do it best. Also known as the Ishikawa Diagram (named after Japanese quality control expert Kaoru Ishikawa), fishbone diagrams allow teams to visualize all possible causes of a problem, to explore and understand how they fit together holistically. Teams can also use fishbone diagrams as a starting point for thinking about what the root cause of a future problem might be.
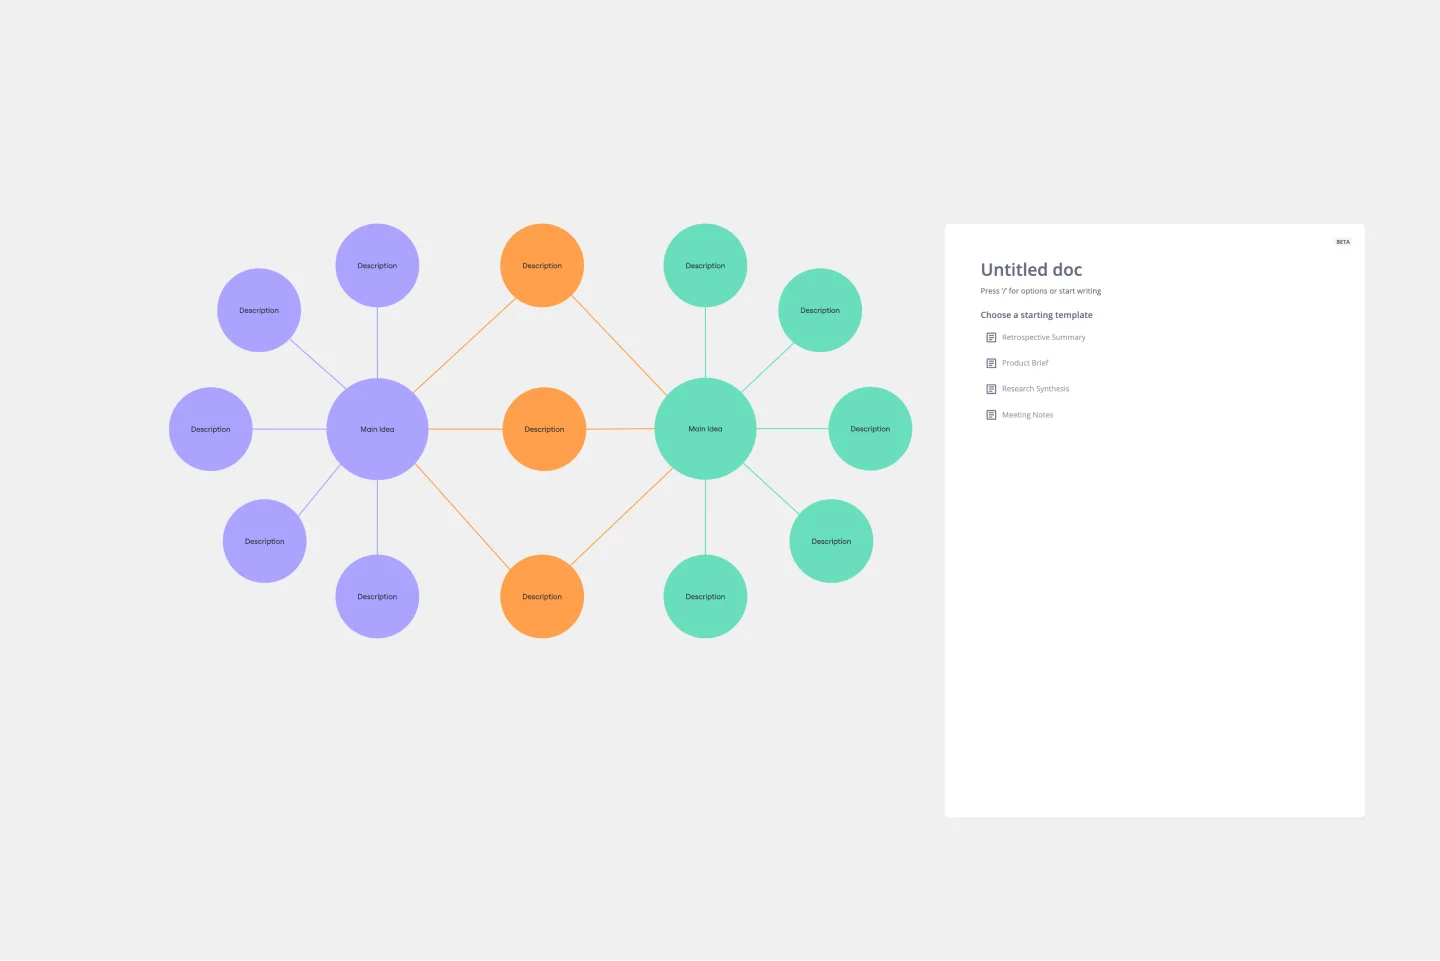
Double Bubble Map Template
Works best for:
Diagramming, Mapping, Brainstorming
Double Bubble Map Template serves as a powerful tool to facilitate teamwork and streamline idea exploration. This adaptable template empowers teams to brainstorm, analyze, and compare concepts with ease, making it an invaluable asset for enhancing creativity and fostering clarity among team members.

20/80 Process Diagram - EOS Compatible
Works best for:
Diagramming
The 20/80 Process Diagram - EOS® Compatible template is a visual tool for mapping out processes and workflows aligned with the Entrepreneurial Operating System (EOS®) methodology. It provides a structured framework for identifying core processes and key activities that drive business outcomes. This template enables organizations to streamline operations, clarify roles and responsibilities, and enhance accountability. By promoting alignment with EOS® principles, the 20/80 Process Diagram empowers teams to achieve organizational excellence and drive sustainable growth.
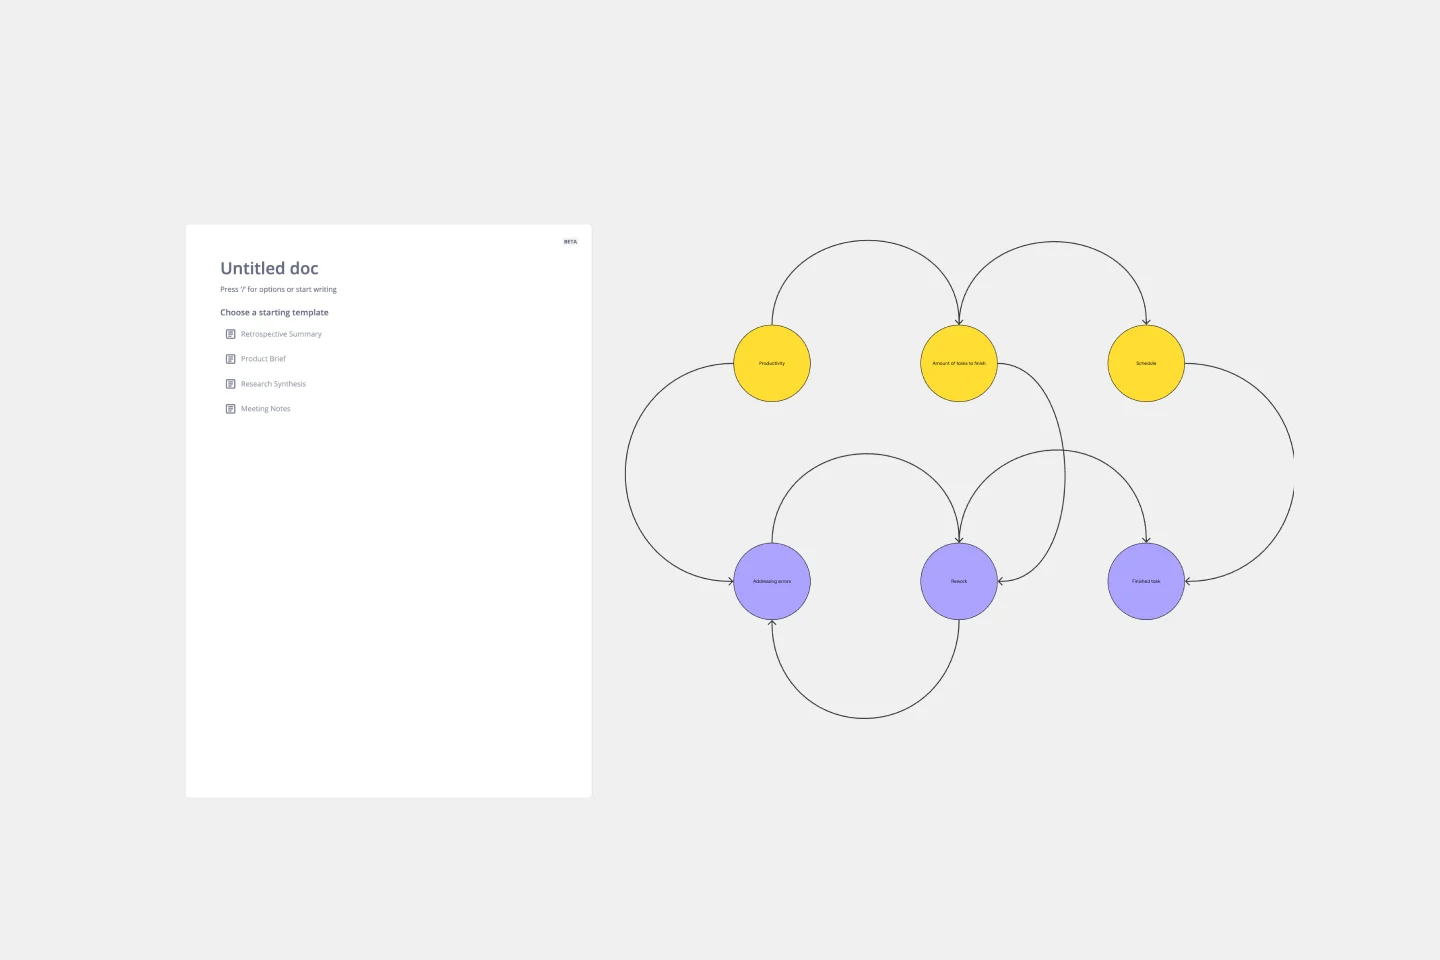
Causal Loop Diagram Template
Works best for:
Diagramming
The Causal Loop Diagram Template offers a structured framework to visualize the intricate interconnections within any system. Its standout benefit is the ability to provide a holistic perspective, ensuring that users don't just see isolated issues but understand the entire web of relationships, ultimately leading to more informed and strategic decision-making.
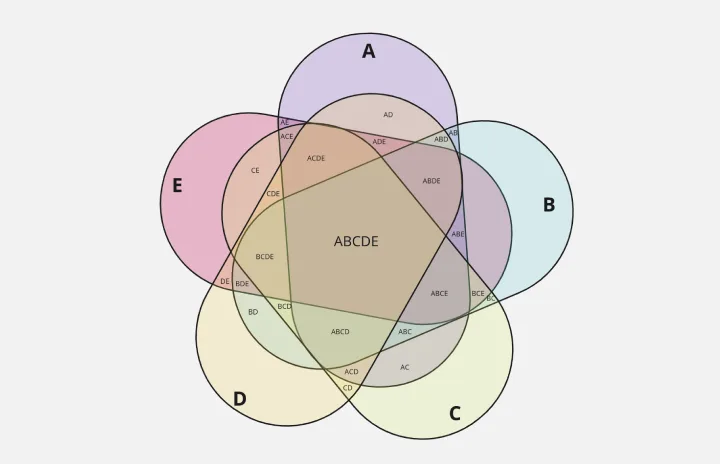
5-Set Venn Diagram
Works best for:
Venn Diagram
Analyze complex data with the 5 Set Venn Diagram template. This tool allows you to compare and contrast five different sets of data, highlighting intersections and unique elements. Perfect for in-depth data analysis, research, and strategic planning. Ideal for analysts, researchers, and educators looking to present comprehensive data insights in a clear and visual manner.