Cisco Recommended Security Architecture Template
Map out and present your organization’s network structure.
Available on Enterprise, Business, Education plans.
About the Cisco Data Network Diagram Template
Cisco offers data center and access networking solutions built for scale with industry-leading automation, programmability, and real-time visibility. The Cisco Data Network Diagram template can help you design and showcase the organization’s network infrastructure.
Keep reading to learn more about the Cisco Data Network Diagram Template.
What is the Cisco Data Network Diagram Template
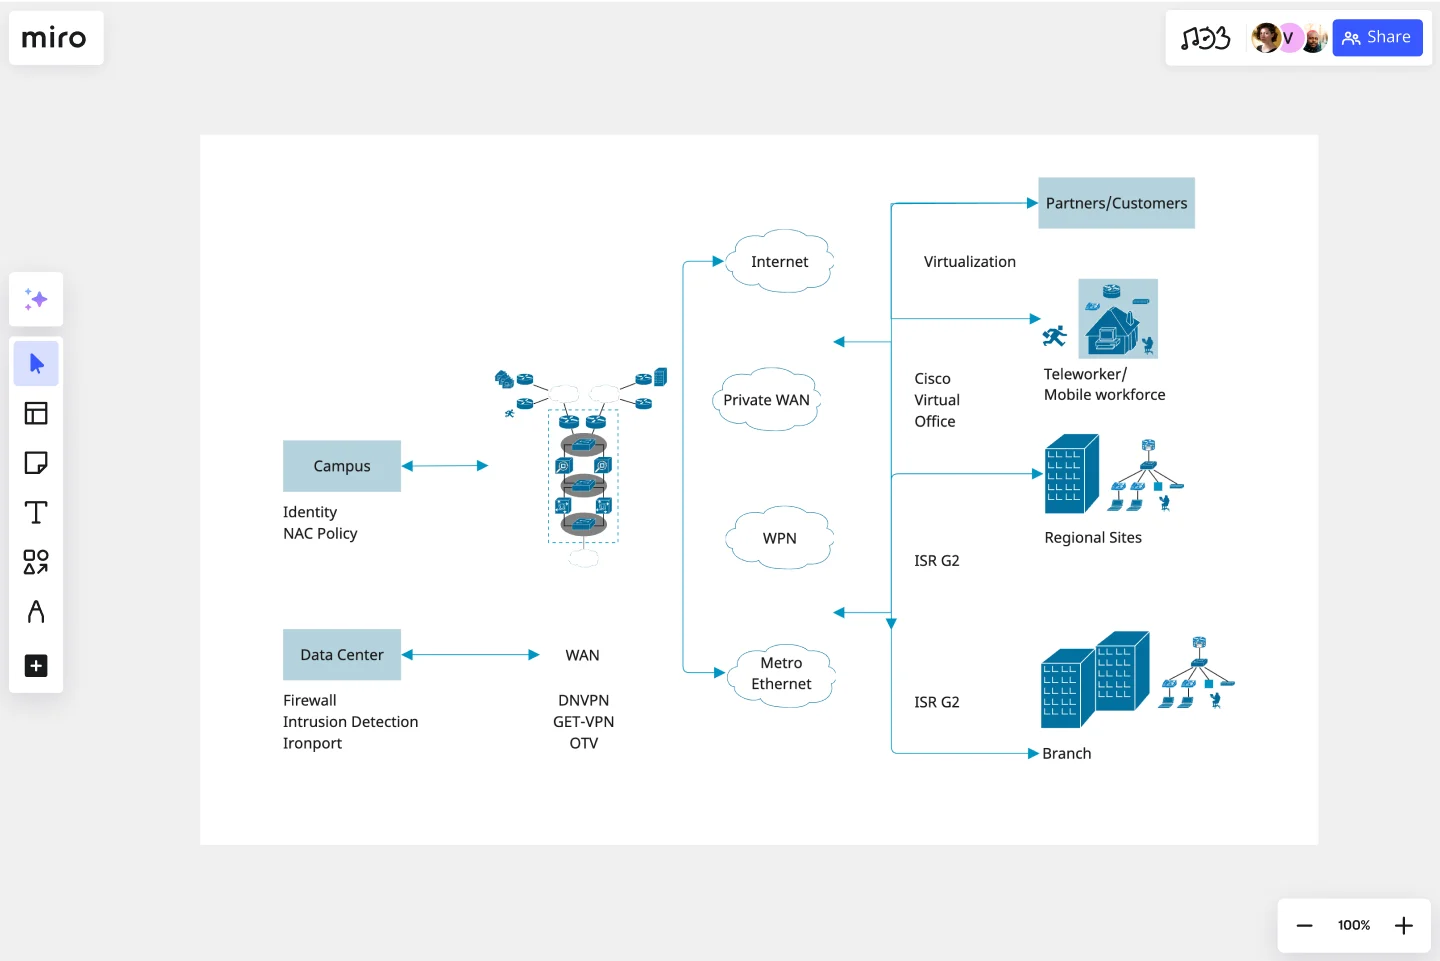
The Cisco Data Network Diagram Template, like any other diagram, visually shows the design of the network infrastructure. The Cisco Data Network Diagram has unique icons and symbols.
When to use Cisco Data Network Diagram Template
You can use the Cisco Data Network Diagram Template to visualize the telecommunication and computer network topology and layout.
Here are the the semantics of Cisco Data Network Diagrams:
Shapes: Icons represent a Cisco service or product.
Connectors: Use arrows to indicate flows (e.g. data, information, communication). Use a single-headed arrow to indicate a single initiator. Use a double-headed arrow to indicate that the icon shown at either end of the arrow can initiate a flow.
Layout and Grouping: Groups show the connection between multiple services/products and can represent layers of the architecture
Miro's diagramming tool also makes it easy to create your network diagram online — with many shape packs, over 2000 icons to diagram from scratch with, and the ability to create in Diagramming Mode for a more focused diagramming experience. This makes Miro the perfect Cisco network diagram tool to suit your needs.
How do I make a Cisco Data Network Diagram Template?
To make a Cisco Data Network Diagram in Miro is easy. You can use our Cisco Data Network Diagram Template and customize it as you see fit. Once you have the diagram structure, you can start adding the icons. You can find the icons under our Cisco Icon Set integration.
Get started with this template right now. Available on Enterprise, Business, Education plans.
System Context Diagram
Works best for:
Diagramming
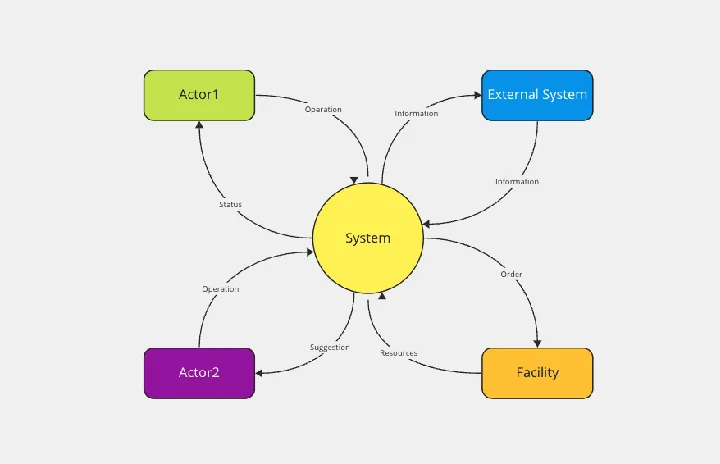
The System Context Diagram template is a visual tool for illustrating the relationships between a system and its external entities. It provides elements for depicting system boundaries, interfaces, and interactions with external stakeholders. This template enables teams to understand the broader context in which a system operates, facilitating requirements analysis and design decision-making. By promoting clarity and alignment, the System Context Diagram empowers teams to design systems that meet stakeholder needs and integrate seamlessly with their environment.
Ansoff Matrix Template
Works best for:
Leadership, Operations, Strategic Planning
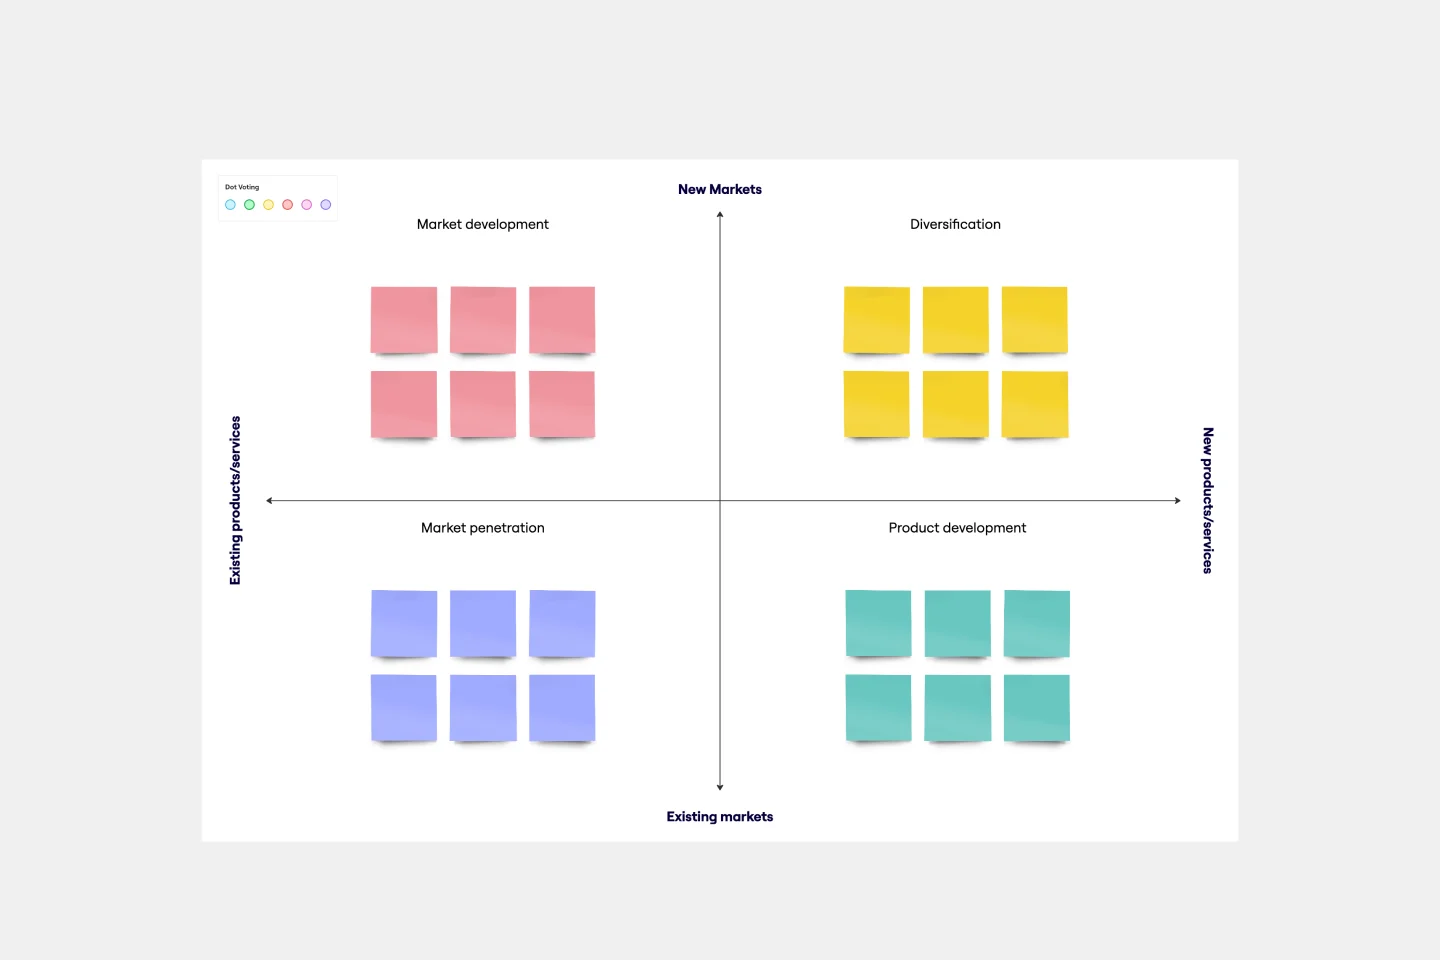
Keep growing. Keep scaling. Keep finding those new opportunities in new markets—and creative new ways to reach customers there. Sound like your approach? Then this template might be a great fit. An Ansoff Matrix (aka, a product or market expansion grid) is broken into four potential growth strategies: Market Penetration, Market Development, Product Development, and Diversification. When you go through each section with your team, you’ll get a clear view of your options going forward and the potential risks and rewards of each.
UML Class Diagram by Dmitry Ermakov
Works best for:
Customer Journey Map
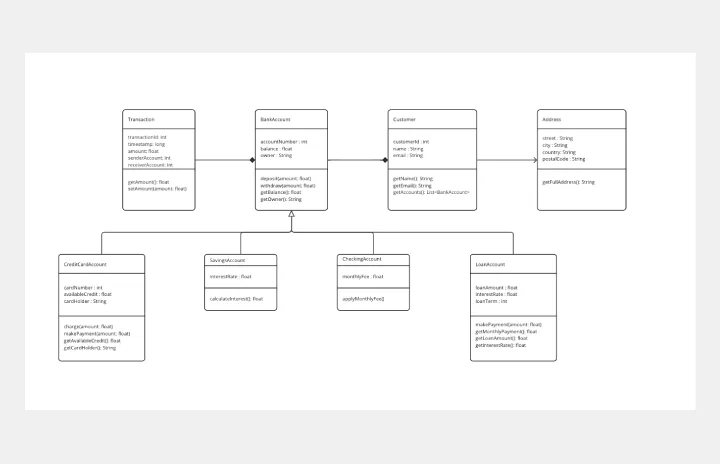
A UML (Unified Modeling Language) Class diagram is a visual representation that shows the structure and relationships of classes in a system or software application.
AWS Git to S3 Webhooks Template
Works best for:
Software Development, Diagrams
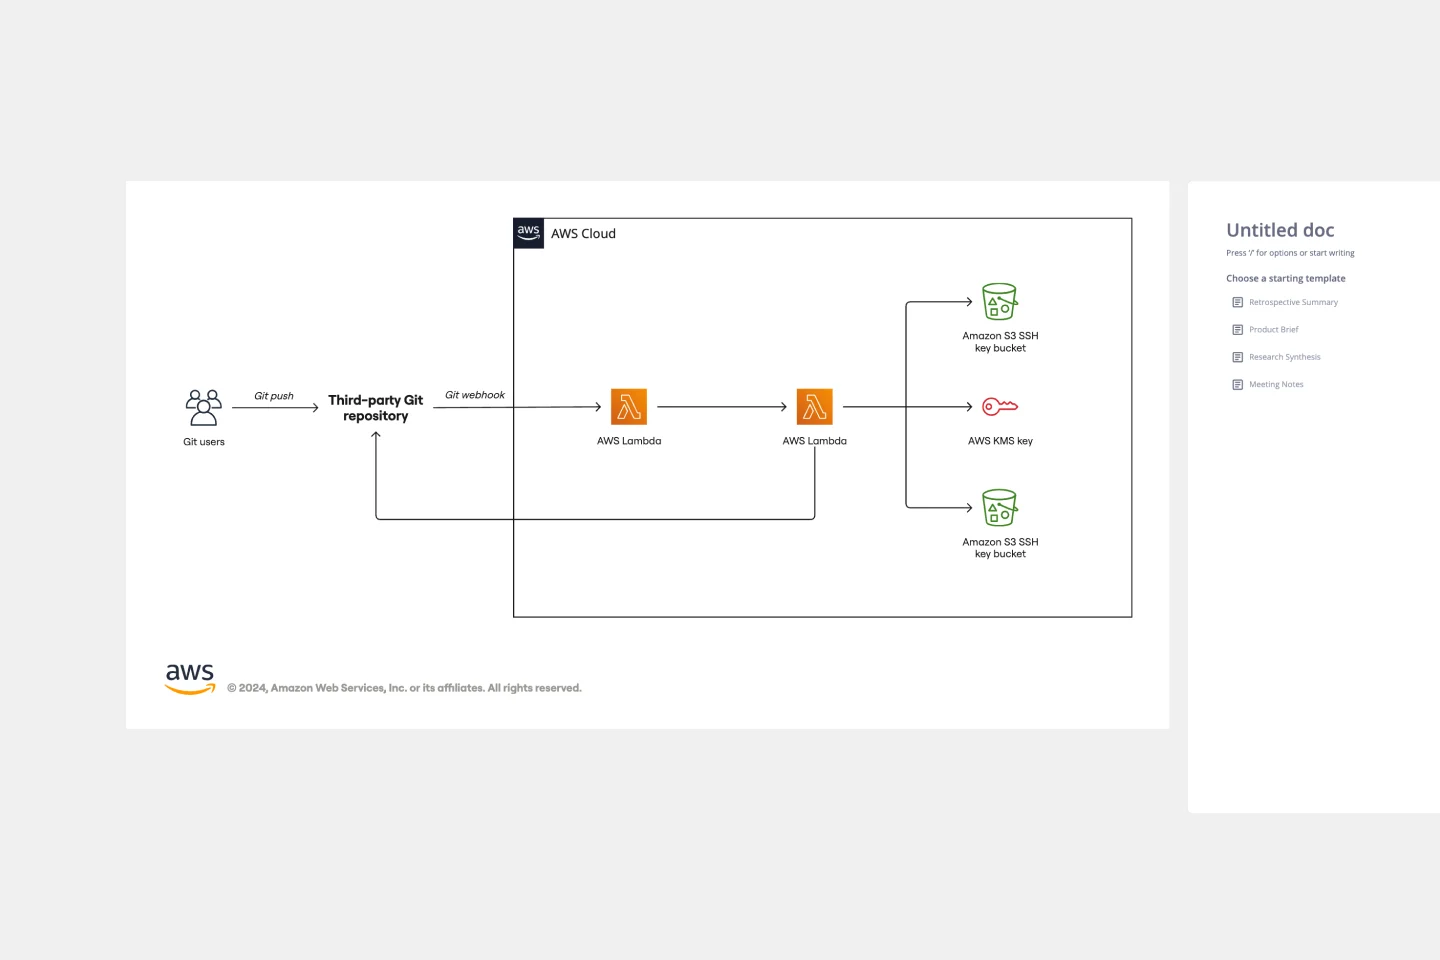
The AWS Git to S3 Webhooks Template is a visual representation of Git webhooks with AWS services Quick Start architecture. You can now have an overview of your AWS architecture with Miro’s AWS Git to S3 Webhooks Template, track your cloud solutions easily, and optimize processes like never before.
Breadboard (UI Flow Diagram)
Works best for:
Diagramming
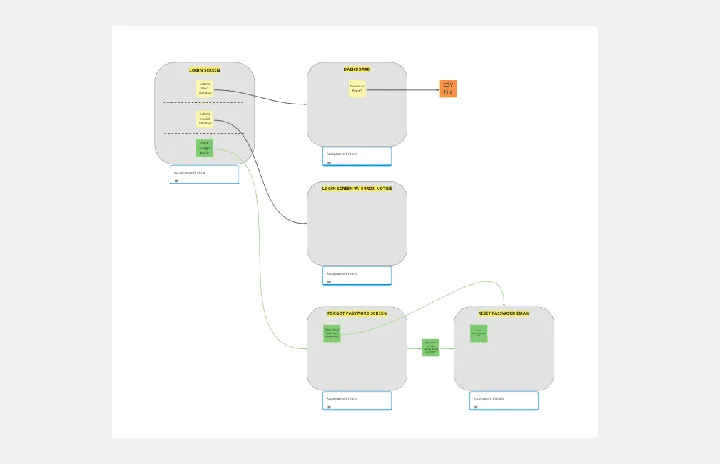
The Breadboard (UI Flow Diagram) template offers a visual framework for designing and prototyping user interfaces (UIs) using the breadboard method. It provides elements for arranging UI components and defining user interactions. This template enables designers and developers to create interactive UI prototypes quickly and iteratively, facilitating user testing and feedback. By promoting rapid prototyping and experimentation, the Breadboard (UI Flow Diagram) empowers teams to design intuitive and user-friendly digital experiences effectively.
5-Circle Venn Diagram Template
Works best for:
Diagramming, Mapping, Brainstorming
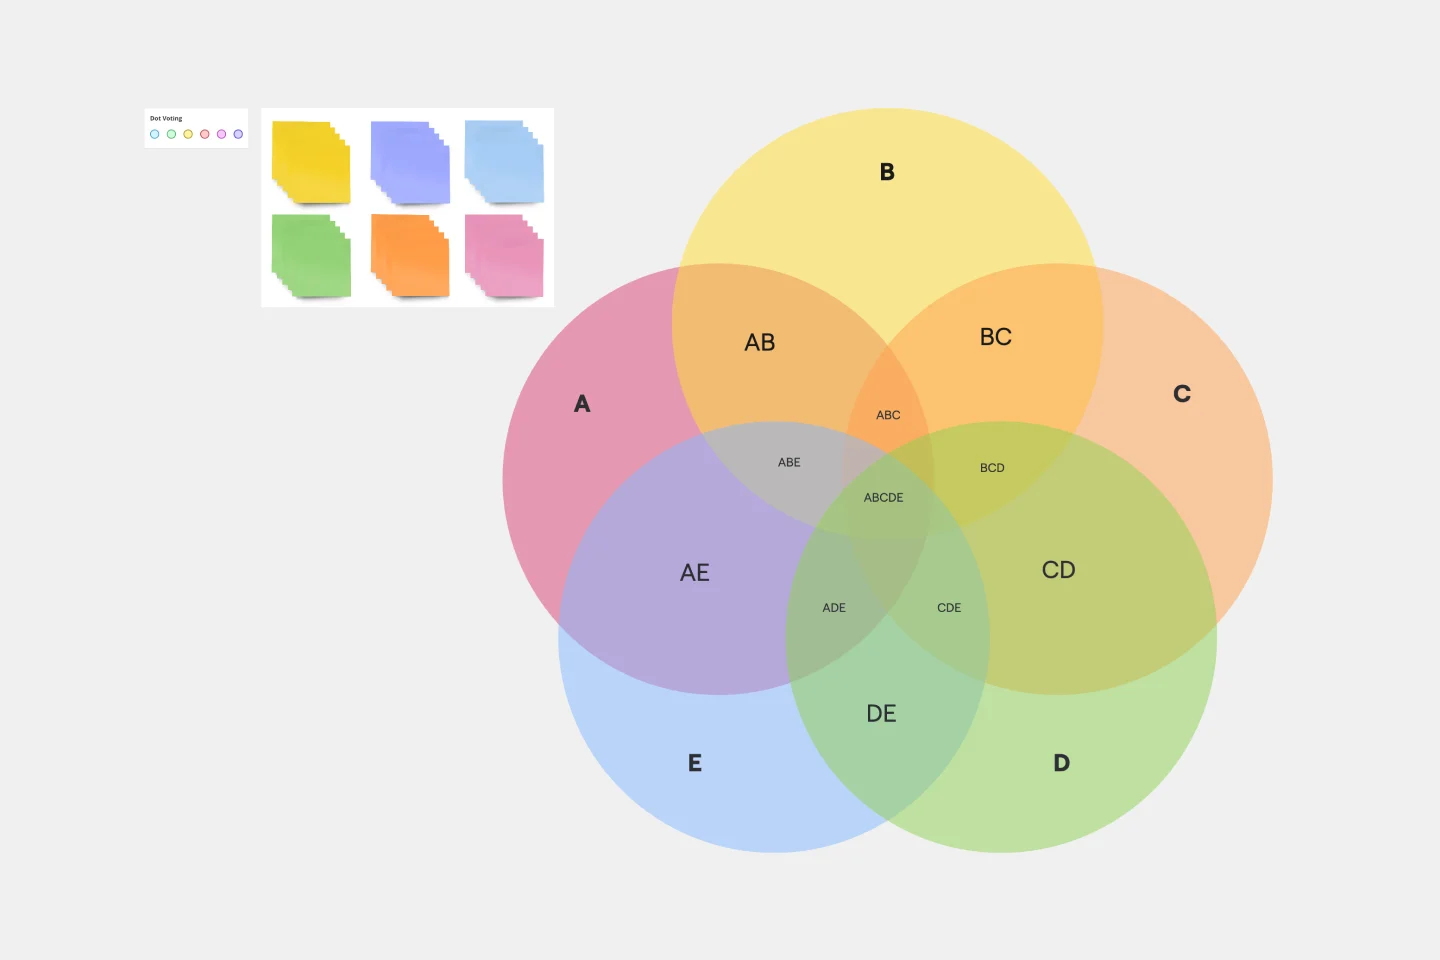
Discover how Miro's 5 Circle Venn Diagram Template can simplify complex decision-making processes. Learn how to create, customize, and share your diagrams for effective visual collaboration. Transform brainstorming sessions with real time, remote teamwork.