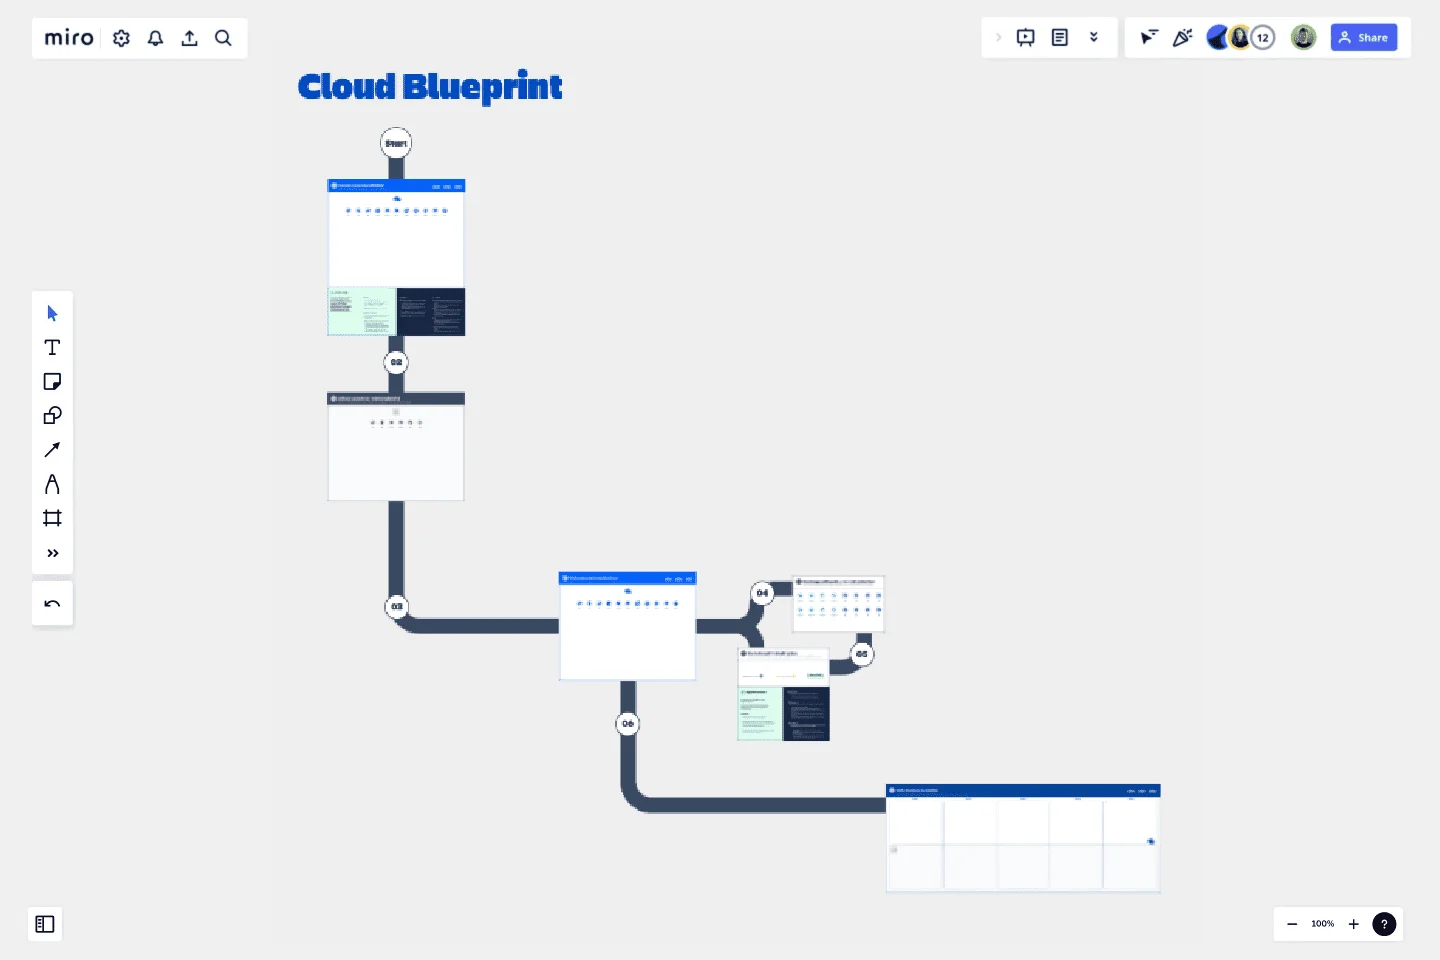
Cloud Blueprint
Make the journey to cloud more than just a copy and paste, and instead take the opportunity for a transformation.
Why create a blueprint?
A blueprint helps you explain where you've come from and where you are going into the future with Atlassian Cloud. Most importantly, it helps you find your narrative on why and how to make the move. Done early in your Cloud migration planning, this can help you confidently decide exactly what will migrate, from where to where, who and when.
It is especially useful if you feel that your current setup is not optimised and need to investigate the value unlocked by transformation.
Who to invite to run the workshop?
It's import to run this with a well rounded crew of stakeholders, such as system administrators, project leads, end users and business strategy and operations experts who can contribute to designing your future state in cloud. You want to assemble a team that will embrace the pros and cons of different cloud architectures, so that you arrive at the right design.
At the end of this workshop you’ll produce what is known in the industry as a tenant map, which visualises your migration paths.
How to use the blueprint?
Key steps:
Determine your dream state in Cloud - How will you organise your teams in Cloud that best supports your future way of working?
Audit what you have on Server - How are your teams organised today on Server?
Bring your present and future state ideas onto the one map
Don’t forget apps and integrations attached to your core data and how they will move
Map where you data will more from and to, and at what rate of change (all at once, by cohort or by start fresh).
Convert your tenant map into a Project timeline
Detailed instructions are provided on the Mire board itself when you use this template. Also, check out the demo video below!
Presto - you’ve got a strategic plan for your move to Cloud!
Designing the right tenant map may take multiple rounds and is best done iteratively, in consultation with the wider business. Plan for a series of 1-2hr workshops.
This template was created by Jason Wong.
Get started with this template right now.
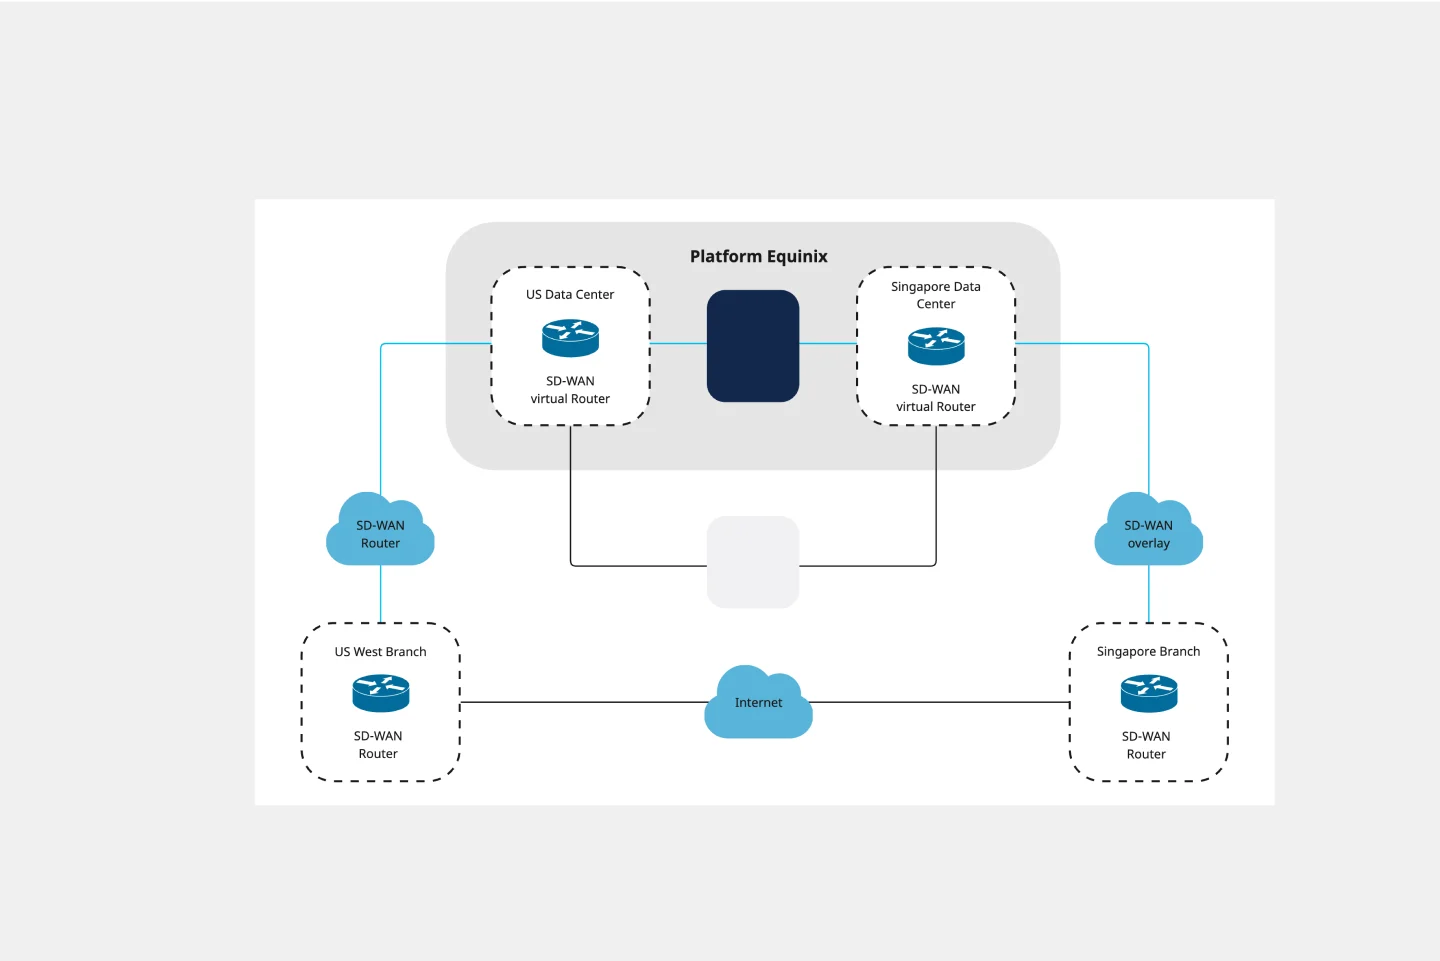
Cisco Data Network Diagram Template
Works best for:
Software Development
Cisco offers data center and access networking solutions built for scale with industry-leading automation, programmability, and real-time visibility. The Cisco Data Network Diagram uses Cisco elements to show the network design of Cisco Data Networks visually.
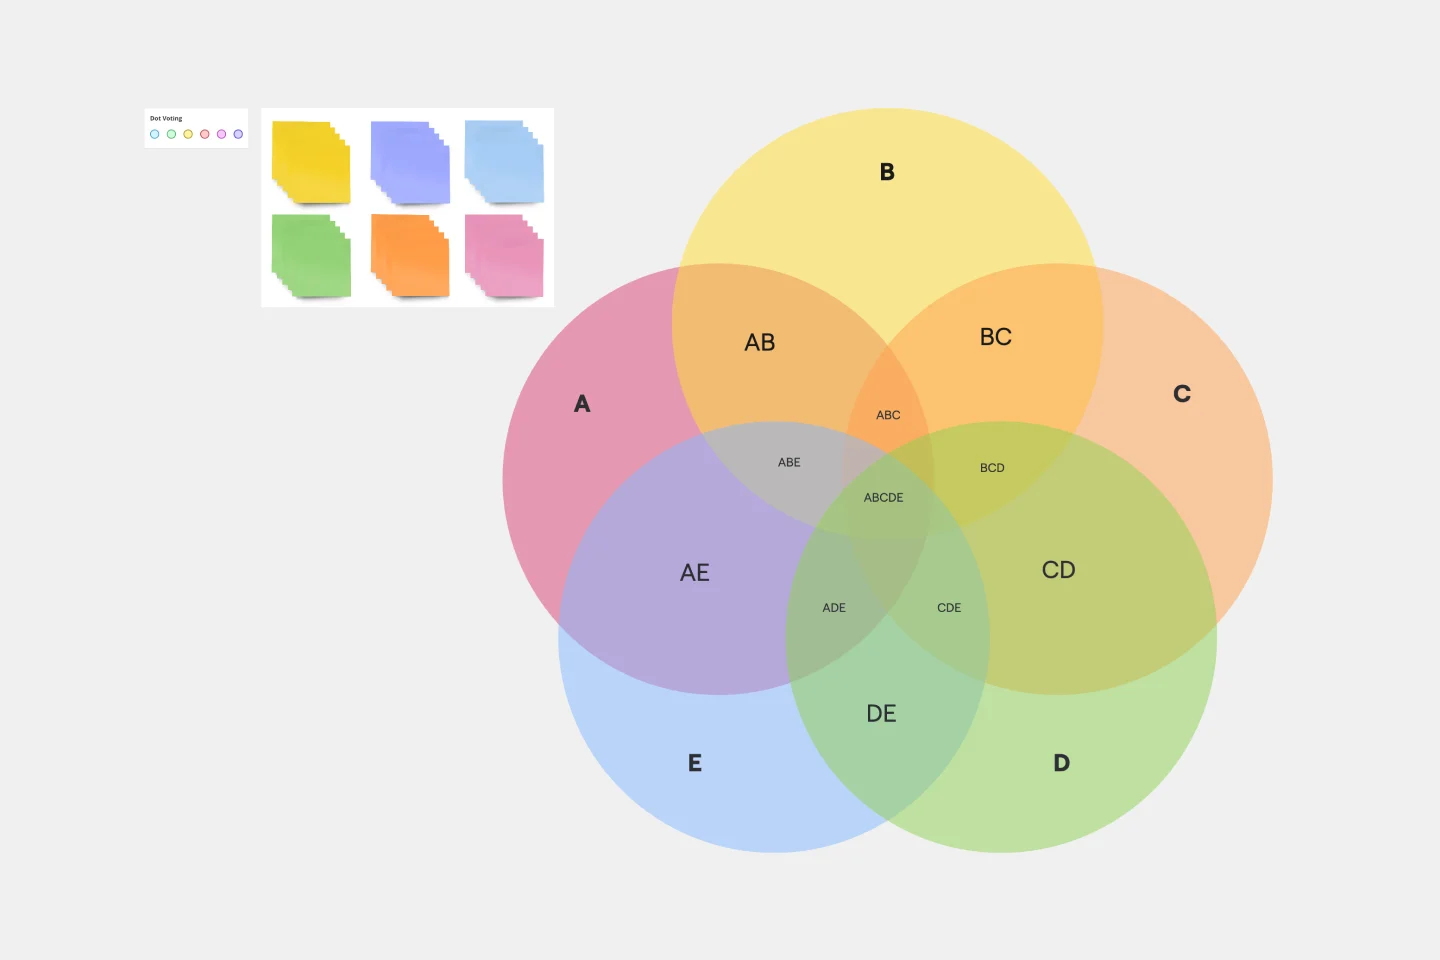
5-Circle Venn Diagram Template
Works best for:
Diagramming, Mapping, Brainstorming
Discover how Miro's 5 Circle Venn Diagram Template can simplify complex decision-making processes. Learn how to create, customize, and share your diagrams for effective visual collaboration. Transform brainstorming sessions with real time, remote teamwork.
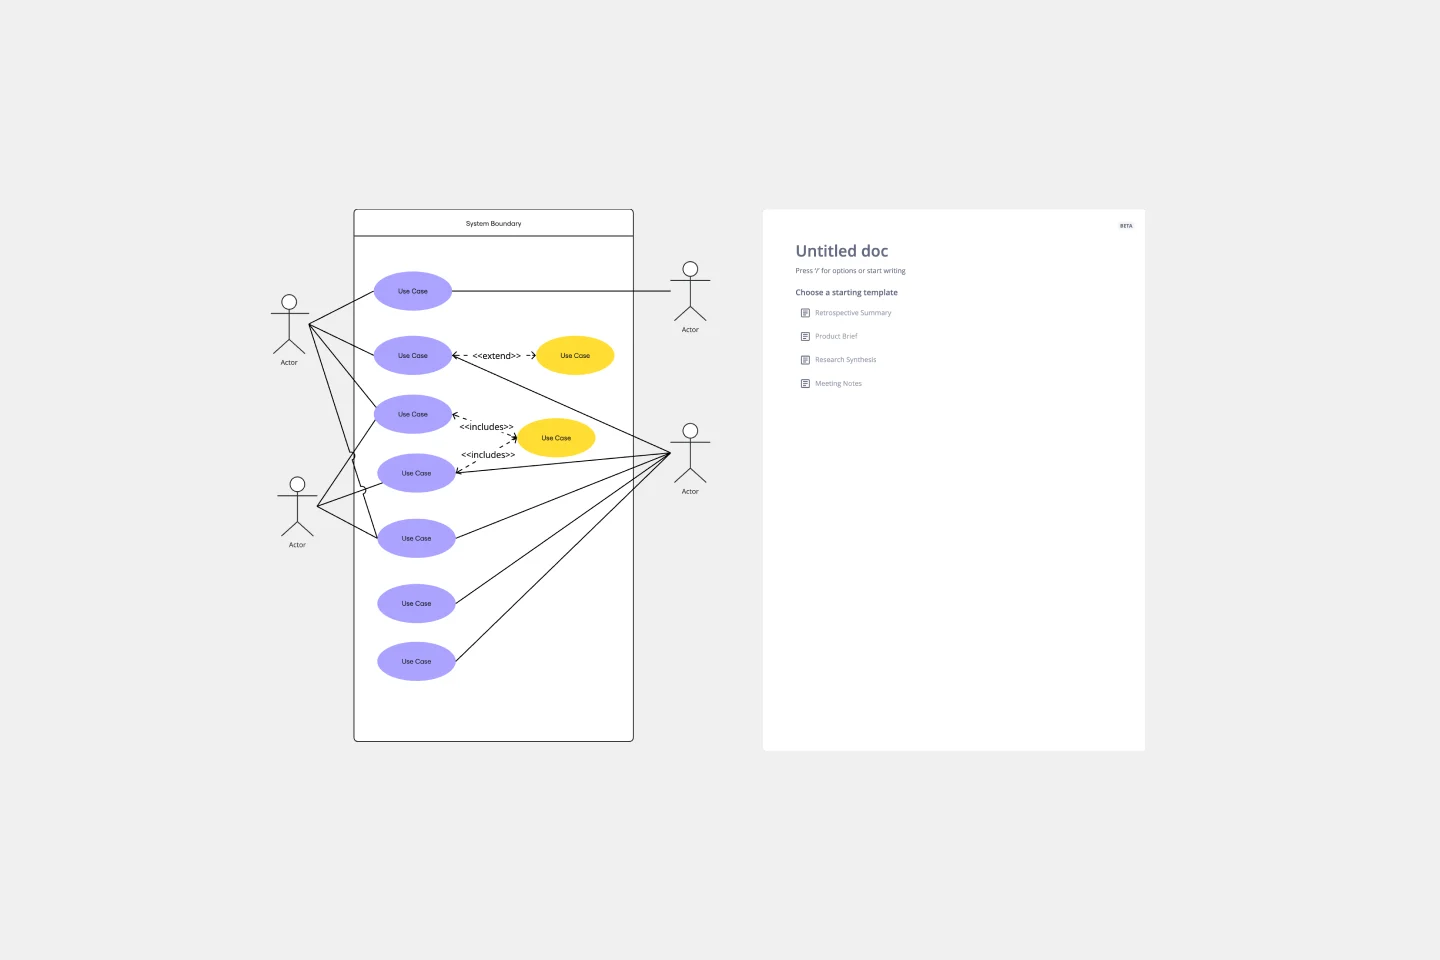
Use Case Diagram Template
Works best for:
Marketing, Market Research, Diagrams
A use case diagram is a visual tool that helps you analyze the relationships between personas and use cases. Use case diagrams typically depict the expected behavior of the system: what will happen and when. A use case diagram is helpful because it allows you to design a system from the perspective of the end user. It’s a valuable tool for communicating your desired system behavior in the language of the user, by specifying all externally visible system behavior.
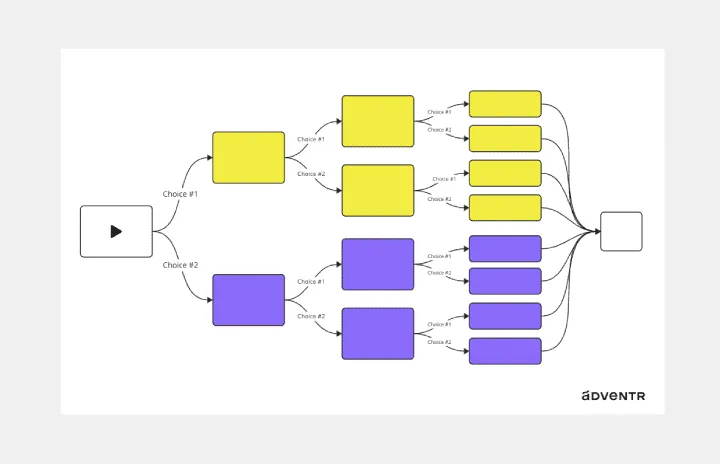
Interactive Video Storyboard Canvas
Works best for:
Diagramming
The Interactive Video Storyboard Canvas template offers a visual framework for planning and storyboarding interactive video content. It provides elements for outlining scenes, defining interactions, and visualizing user pathways. This template enables teams to design engaging and immersive video experiences, facilitating collaboration and alignment among content creators and stakeholders. By promoting creativity and interactivity, the Interactive Video Storyboard Canvas empowers teams to create compelling video narratives that captivate audiences and drive engagement.
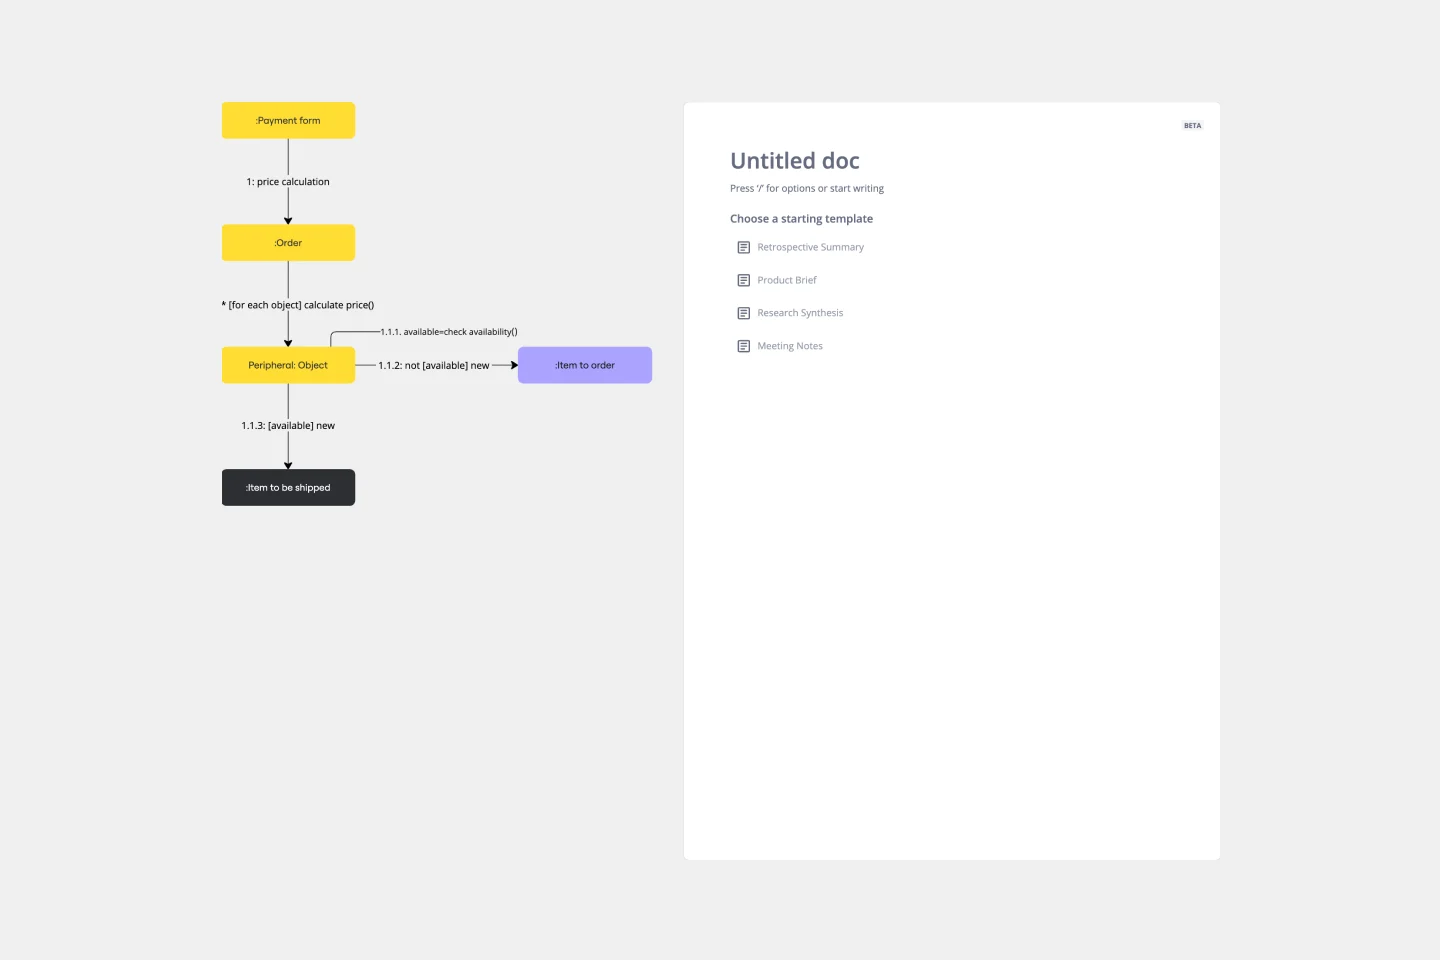
UML Communication Diagram Template
Works best for:
Software Development, Mapping, Diagrams
Most modern programs consist of many moving parts working to a precise set of instructions. With a communication diagram, you can visualize exactly how those parts work together, giving you a clearer understanding of your program as a whole. What’s more, the diagram leaves spaces for expanding the network of relationships as your product grows and evolves. A communication diagram is a vital tool in any software designer’s arsenal.
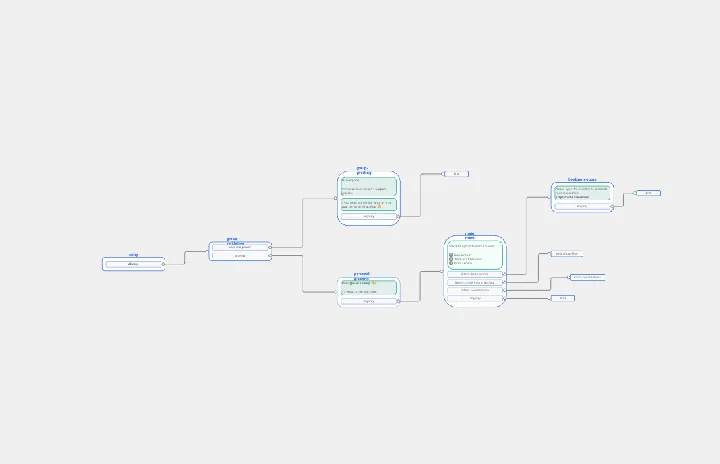
Chat-Bot
Works best for:
Diagramming
The Chat Bot template is a visual tool for designing and mapping out chatbot interactions and functionalities. It provides a structured framework for visualizing conversation flows, user inputs, and bot responses. This template enables teams to collaborate on designing chatbot experiences that are intuitive and user-friendly, driving engagement and satisfaction. By promoting clarity and alignment, the Chat-Bot template empowers organizations to create effective chatbot solutions that meet user needs and business objectives.