Comprehensive Guide to BPMN
Tame the Workflow Beast: Your Visual Guide to BPMN with Miro!
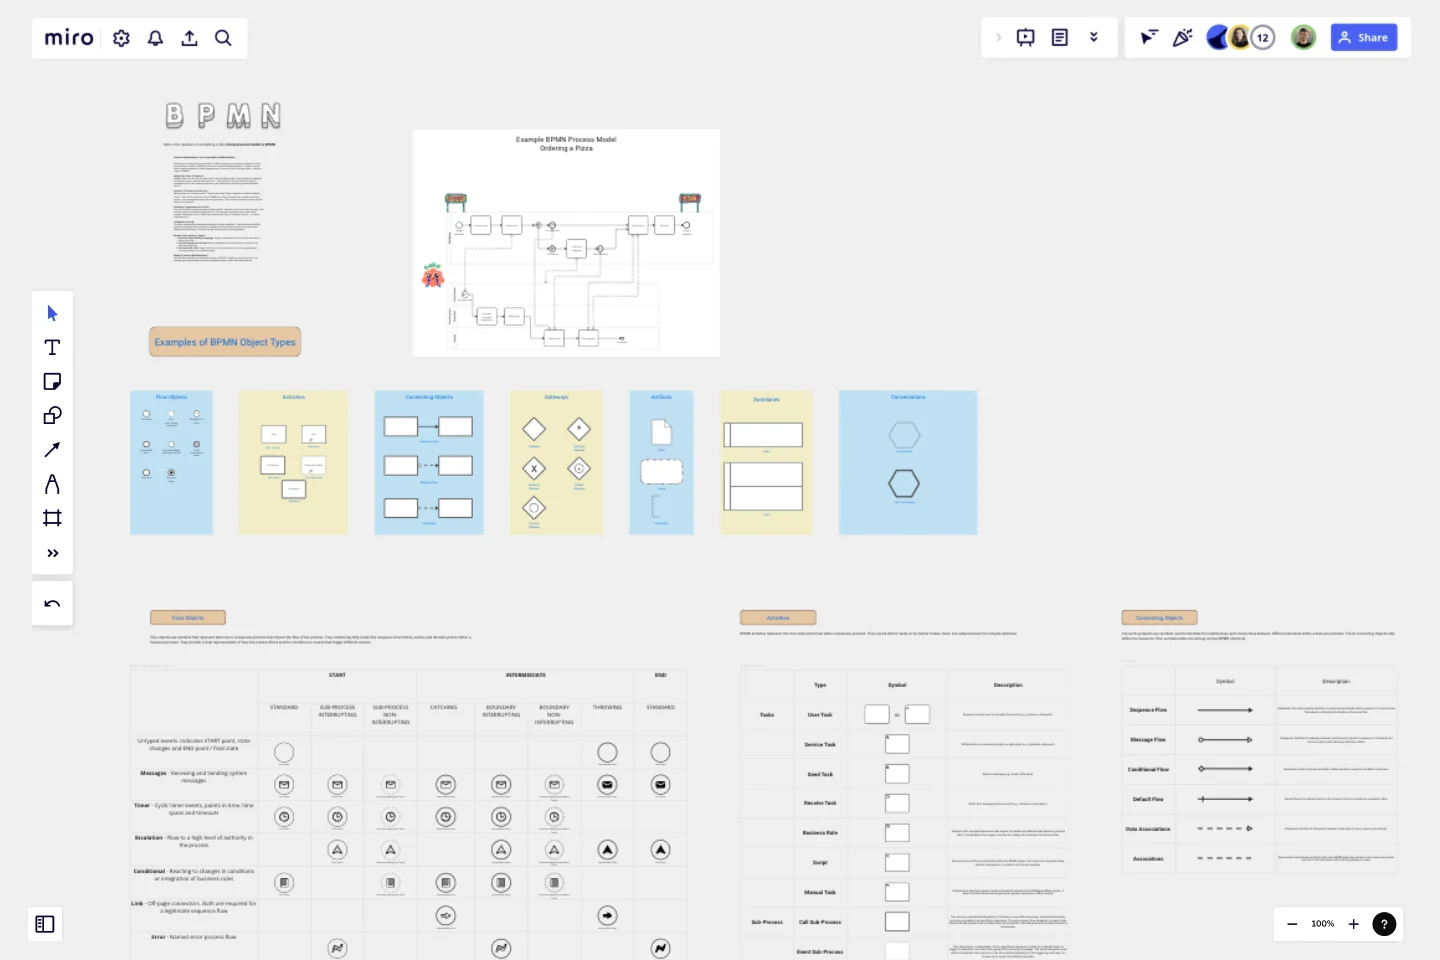
Feeling lost in a labyrinth of processes? This Miro template is your key to escaping the chaos and wielding the power of BPMN, or Business Process Modelling Notation. Imagine a world where everyone speaks the same language when it comes to how things get done – that's the magic of BPMN!
Unleash the Power of Symbols!
BPMN is like a secret code, but way cooler. Instead of boring text, it uses symbols to represent the different steps in your business process. Think circles for events that kick things off, rectangles for the core work that gets done, and diamonds for those all-important decision points.
Activities: The Heart of the Process
Need someone to review an order? That's a User Task! Want a system to calculate shipping costs? That's a Service Task in action! BPMN even lets you break down complex tasks into smaller, more manageable steps with sub-processes. Think of them as handy process puzzles you can put together!
Swimlanes: Organisation at its Finest
Ever feel like tasks are bouncing around like pinballs? Swimlanes are here to save the day! They visually organise activities by department or role, making it crystal clear who owns what. Imagine a swimlane for the "Sales Team" and another for the "Fulfilment Centre" – no more finger-pointing!
Collaboration is King!
This Miro template is your battleground against messy workflows. Drag and drop the BPMN symbols, customise the text, and work together with your team to map out your processes. Imagine the satisfaction of finally having a clear picture of how things work!
Benefits Fit for a King (or Queen):
Speak the Same Workflow Language: Everyone understands what needs to be done, by whom, and when.
Spot Bottlenecks Like a Hawk: Identify roadblocks and streamline your processes for maximum efficiency.
Document Like a Pro: Create a clear and concise reference point for your processes, ensuring everyone's on the same page
Ready to Tame the Workflow Beast?
Use this Miro template and unleash the power of BPMN! Together, you and your team can conquer process complexity and build workflows that purr like a well-oiled machine.
This template was created by Paul Snedden.
Get started with this template right now.
Fishbone Diagram Template
Works best for:
Operations, Diagrams, Workflows
What is the best way to solve any problem your team faces? Go straight to the root. That means identifying the root causes of the problem, and fishbone diagrams are designed to help you do it best. Also known as the Ishikawa Diagram (named after Japanese quality control expert Kaoru Ishikawa), fishbone diagrams allow teams to visualize all possible causes of a problem, to explore and understand how they fit together holistically. Teams can also use fishbone diagrams as a starting point for thinking about what the root cause of a future problem might be.
Production Flowchart Template
Works best for:
Flowcharts
The Production Flowchart Template is a well-crafted tool that clearly represents a production process from start to finish. It breaks down complex procedures into easy-to-understand segments, making it easier for stakeholders to grasp the entire process. One of the key benefits of using this template is that it helps to clarify complex production pathways. By mapping out operations visually, teams can identify potential bottlenecks or inefficiencies, facilitating timely and well-informed decision-making.
Entity–Relationship Diagram (ERD) HR Management System Template
Works best for:
ERD
The Entity–Relationship Diagram (ERD) HR Management System Template in Miro is designed to streamline the management of employee-related information and processes within an organization. This template allows for the visualization and organization of complex HR systems, making it easier to understand relationships and processes. It enables users to map out departments, positions, and employee details, including attendance records, payroll, and performance reviews.
DMAIC Analysis Template
Works best for:
Agile Methodology, Design Thinking, Operations
Processes might not seem like the funnest thing to dive into and examine, but wow can it pay off—a more efficient process can lead to serious cost savings and a better product. That’s what DMAIC analysis does. Developed as part of the Six Sigma initiative, DMAIC is a data-driven quality strategy for streamlining processes and resolving issues. The technique is broken into five fundamental steps that are followed in order: Define, Measure, Analyze, Improve, and Control.
Miro for AWS Well-Architected Framework Reviews
Works best for:
Diagramming, AWS
This AWS Well-Architected Framework Review (WAFR) template provides you and your team with a dedicated space to conduct a Well-Architected Framework Review with a client.
AHA! Moment Flowchart
Works best for:
Mapping, Flowcharts
The AHA! Moment Flowchart template offers a visual tool for mapping out the journey of users or customers and identifying key moments of realization or insight (AHA moments). It provides a structured framework for documenting user interactions, emotions, and pain points throughout their journey. This template enables teams to understand user experiences, identify opportunities for improvement, and enhance product or service offerings. By promoting empathy and customer-centric design, the AHA! Moment Flowchart empowers organizations to create meaningful and impactful user experiences effectively.
