Data Flow Diagram Template
Model processes and map data flows efficiently with the data flow diagram template. Improve internal processes and lead development teams with more clarity.
Available on Enterprise, Business, Education plans.
About the Data Flow Diagram Template
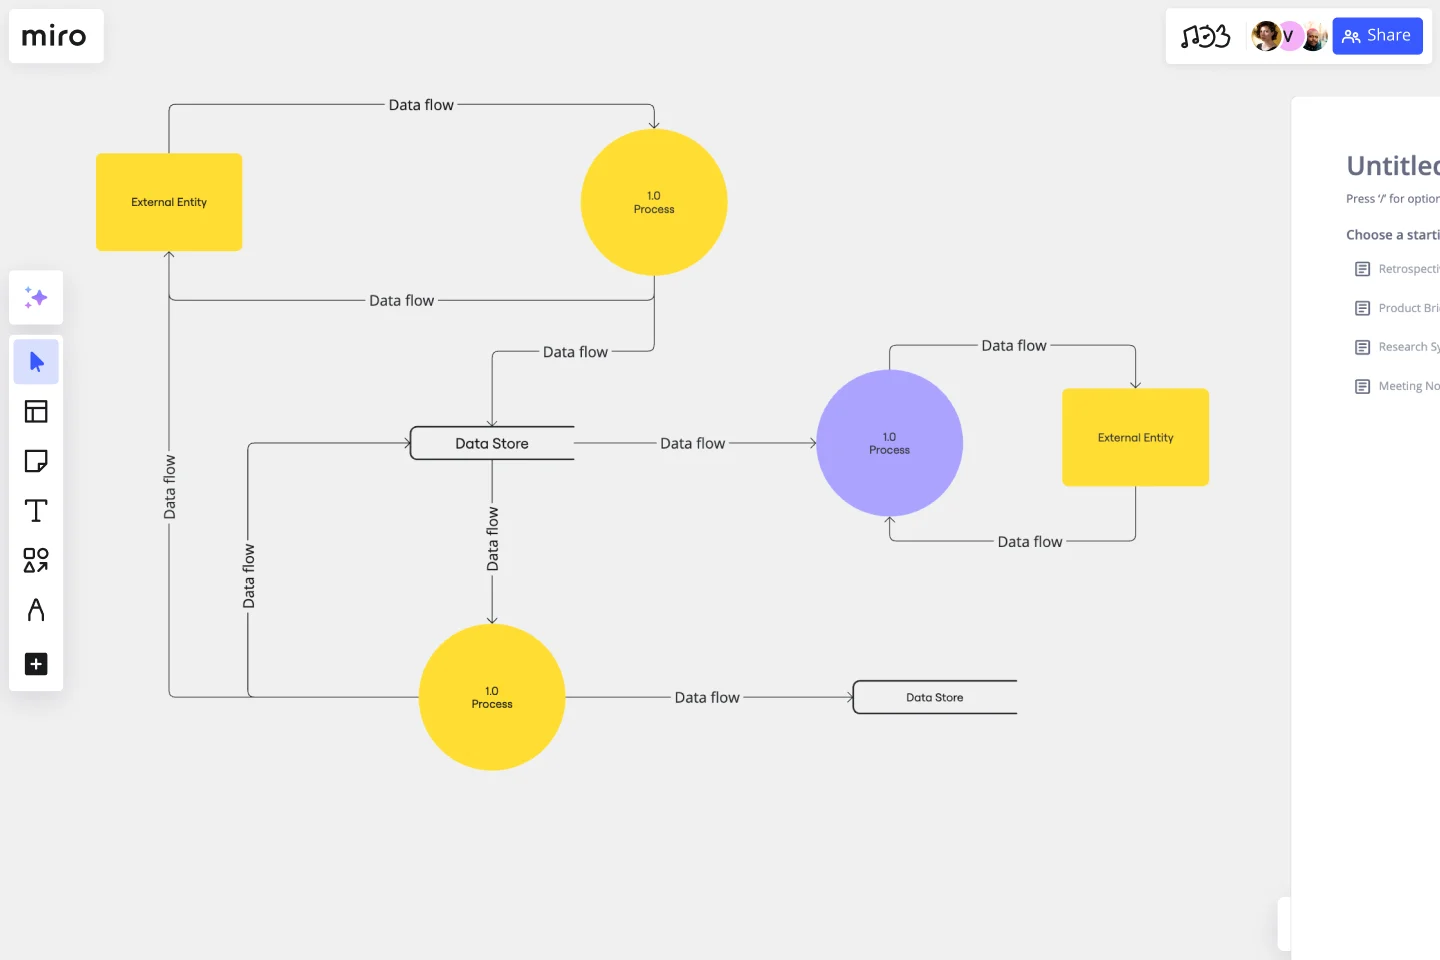
The data flow diagram template is a visual tool you can use to improve your understanding of how data travels within a system — namely by visualizing the inputs, outputs, and the processes involved. Organizations use data flow diagrams (DFD) in many business activities, including depicting notation styles, physical requirements, and system automation.
We’ll walk you through how you can start creating a data flow diagram using Miro’s free and customizable DFD template.
How to use Miro’s data flow diagram template
To get started with Miro’s data flow diagram template, scroll to the top of this page and click on the blue “use template” button. That’ll open the template and allow you to start using Miro’s diagram maker. Once you’ve opened it, think about what type of system you’re trying to visualize — whether it’s a business process, data flow within a software application, or something else. When you’re ready, here are a few more steps to make the most of the data flow diagram template.
1. Identify inputs and outputs
Each process you aim to map out should have at least one input and one output. This helps make sure that your DFD template is complete and has no loose ends. Look for the two blue, rounded rectangles on the left and right of the DFD template marked “external entity,” then edit the text boxes within them to label where the data is entering the system from and where it’ll go. To add more input and output sources, right-click on the rectangle and choose “Duplicate.”
2. Identify processes
On the data flow diagram template, the three circles labeled “Process” are for you to identify the activities or functions that manipulate data in some way. Edit the text boxes to add your system’s processes, and easily delete or duplicate these circles as needed.
3. Identify data stores
There are two symbols on the template labeled “data store.” As its name implies, it refers to where the system stores its data. Double-click on the text boxes to edit them and replace the text with how you want to label your data stores. Duplicate these symbols as needed, and click and drag them if you’d like to adjust their position on the diagram.
4. Label data flows
Last but not least, don’t forget to visualize the flow of data. The template comes with arrows connecting inputs, outputs, processes, and data stores. Edit the text along these arrows to identify the type of data that’s traveling, and click and drag them to adjust the direction of flow appropriately.
Is Miro’s data flow diagram template free?
Yes, Miro’s data flow diagram template is free and fully customizable, so you can make it your own. Just click on the blue “use template” button on this page to get started.
Who is Miro’s data flow diagram template for?
Miro’s data flow diagram template is for any team involved in system development, analysis, optimization, and collaboration — including data analysts, software development teams, growth teams, and product teams.
What’s the difference between a data flow diagram and a flowchart?
A data flow diagram is your guide to understanding the nitty-gritty of how information travels within a system — such as databases, software applications, and business processes. While a flowchart also visualizes flows, it isn’t limited to representing data. Flowcharts are versatile maps that outline processes, decisions, and actions much more broadly. Miro's free data flow diagram template is specially crafted to visualize the intricacies of data flow within complex systems.
Get started with this template right now. Available on Enterprise, Business, Education plans.
UML Class Content Management System (CMS) Template
Works best for:
UML
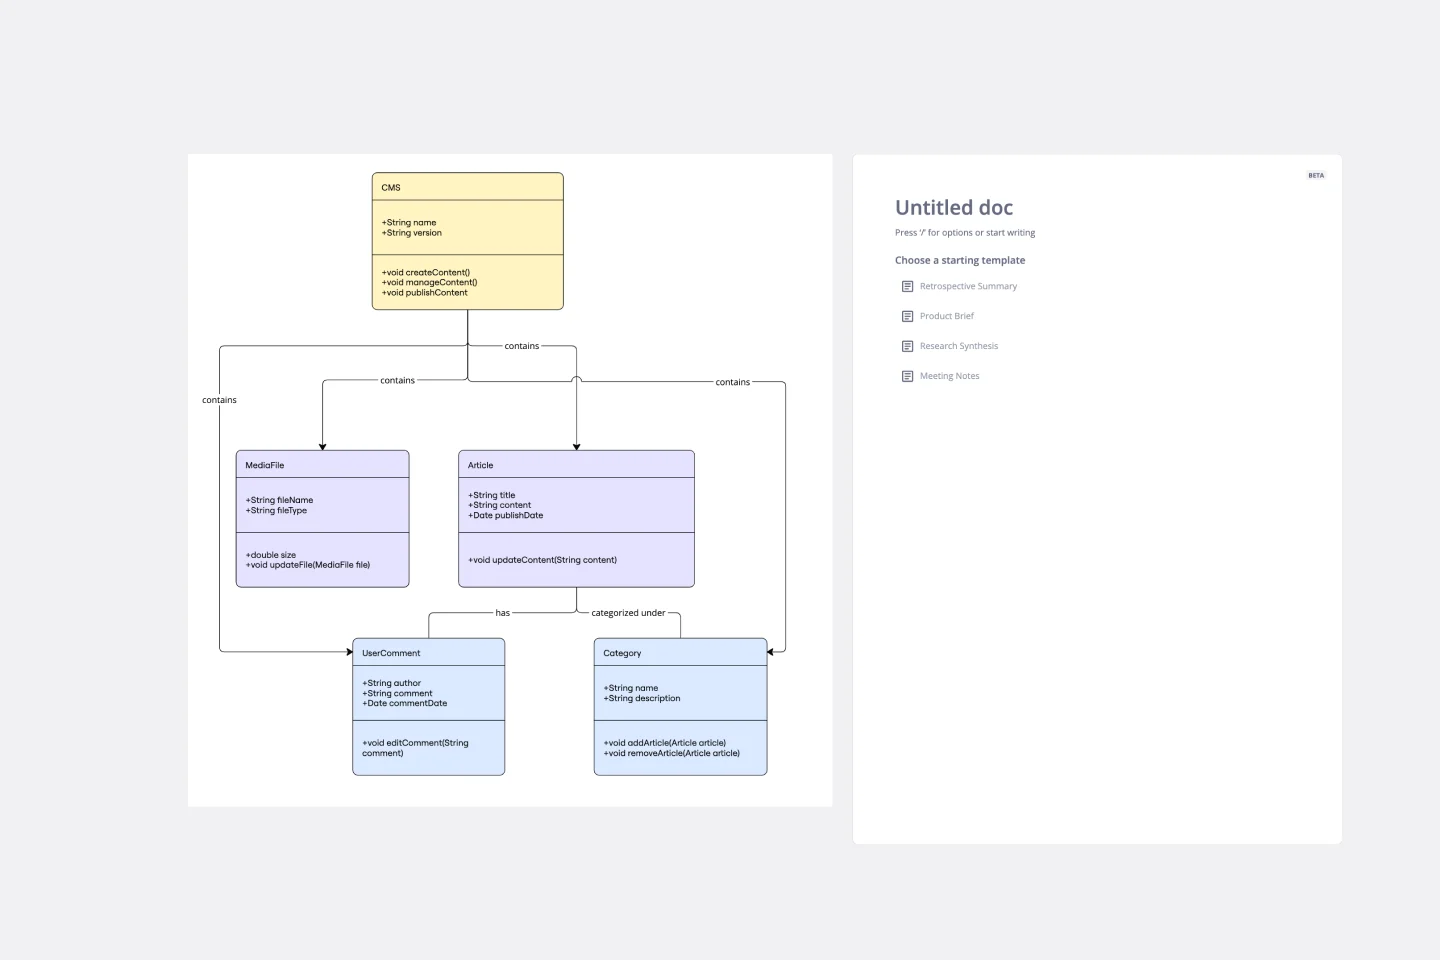
The UML Class Content Management System CMS Template simplifies documenting and designing the architecture of a Content Management System. It allows for the creation of UML class diagrams to visualize the structure of a CMS. Teams can efficiently map out key classes and their interactions, such as how users create, manage, and publish digital content. The template's integration into Miro's collaborative platform allows for real-time teamwork, customization, and easy sharing of feedback. This streamlines the documentation process and is valuable for software development projects aiming to develop or refine a CMS.
Strategic Technology Roadmap Worksheets
Works best for:
Roadmap, Planning, Mapping
We all know that technology commercialization success starts with the end in mind, a product with market viability.
Objectives and Key Results (OKRs) Template
Works best for:
Leadership, Strategic Planning, Project Planning
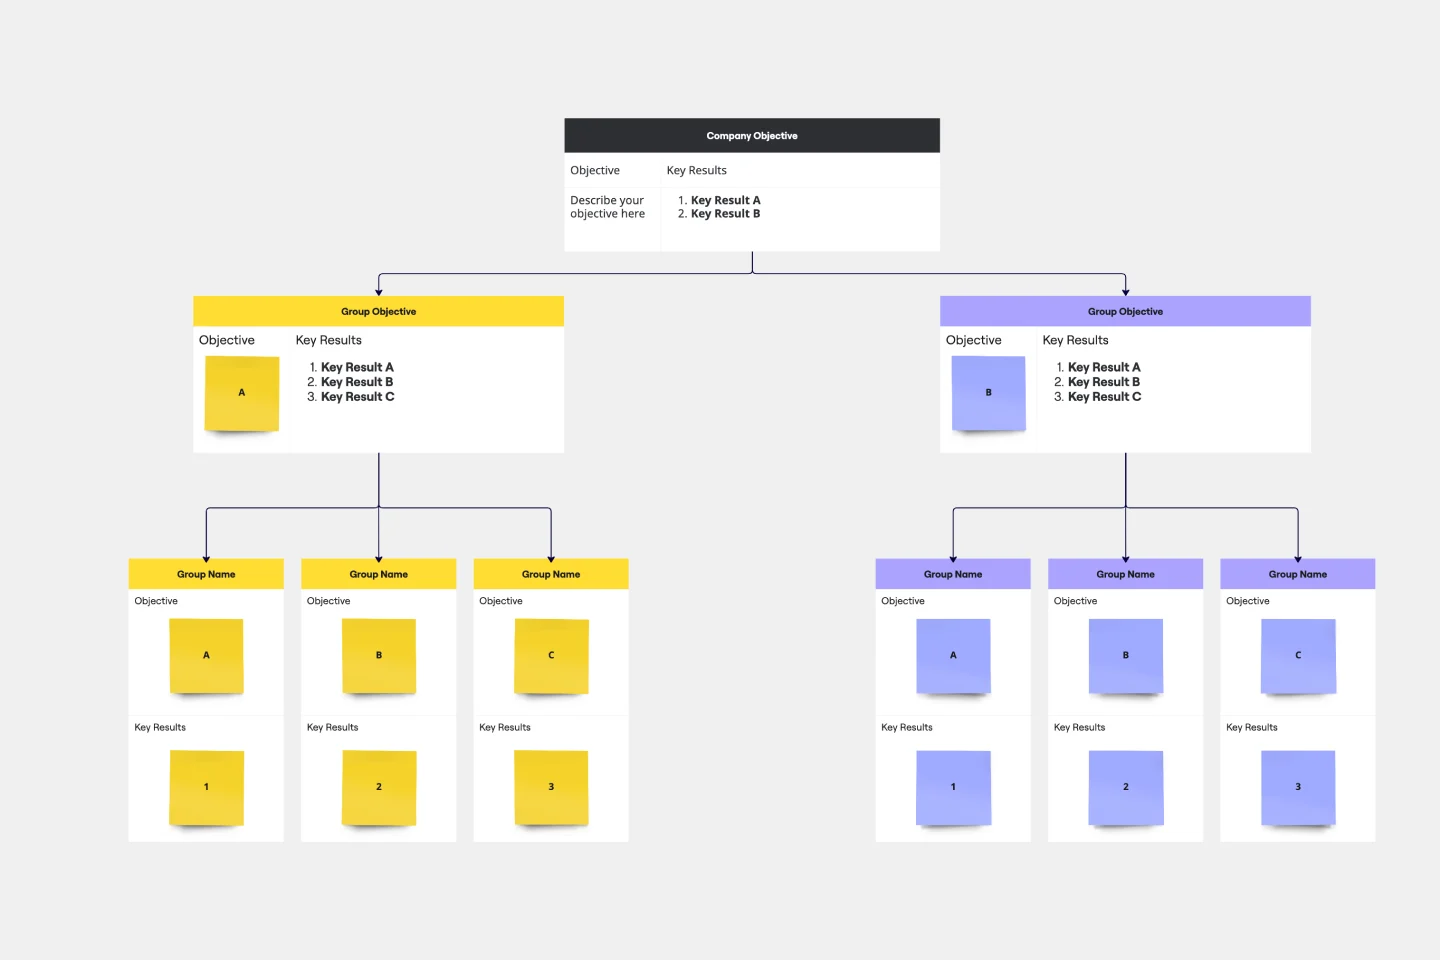
Clarity, focus, and structure — those are the key ingredients to feeling confident in your company’s directions and decisions, and an OKR framework is designed to give them to you. Working on two main levels — strategic and operational — OKRs (short for objectives and key results) help an organization’s leaders determine the strategic objectives and define quarterly key results, which are then connected to initiatives. That’s how OKRs empower teams to focus on solving the most pressing organizational problems they face.
Product Vision Statement
Works best for:
Product Management, Planning
The Product Vision Statement template helps product teams articulate clear and inspiring visions for product development. By defining long-term goals, market aspirations, and customer value propositions, this template aligns teams around a shared vision for success. With sections for outlining strategic objectives, guiding principles, and success metrics, it provides clarity and direction for product development efforts. This template serves as a compass for product teams, guiding them towards meaningful outcomes and driving innovation and growth.
Opportunity Canvas Template
Works best for:
Leadership, Decision Making, Strategic Planning
Features and capabilities — they make or break a product, which is why companies spend so much time and effort focusing on them. Sound like you? Try it with an Opportunity Canvas. This streamlined one-pager gives you and your team the power to improve your product by exploring the use cases, potential setbacks, strategies, challenges, and metrics. An Opportunity Canvas is ideal if you’ve already built a product, because you don’t need to consider the operational or revenue model.
Idea Funnel Backlog
Works best for:
Design, Brainstorming, Agile Workflows
An Idea Funnel Backlog enables you to visualize your backlog and restrict the number of backlogged items at the top. In doing sos, you can prioritize items on your list without having to engage in unnecessary meetings or create too much operational overhead. To use the Idea Funnel Backlog, break up the funnel into different phases or treat it like a roadmap. Use the Idea Funnel Backlog as a hybrid model that combines your roadmap and backlog into one easily digestible format.