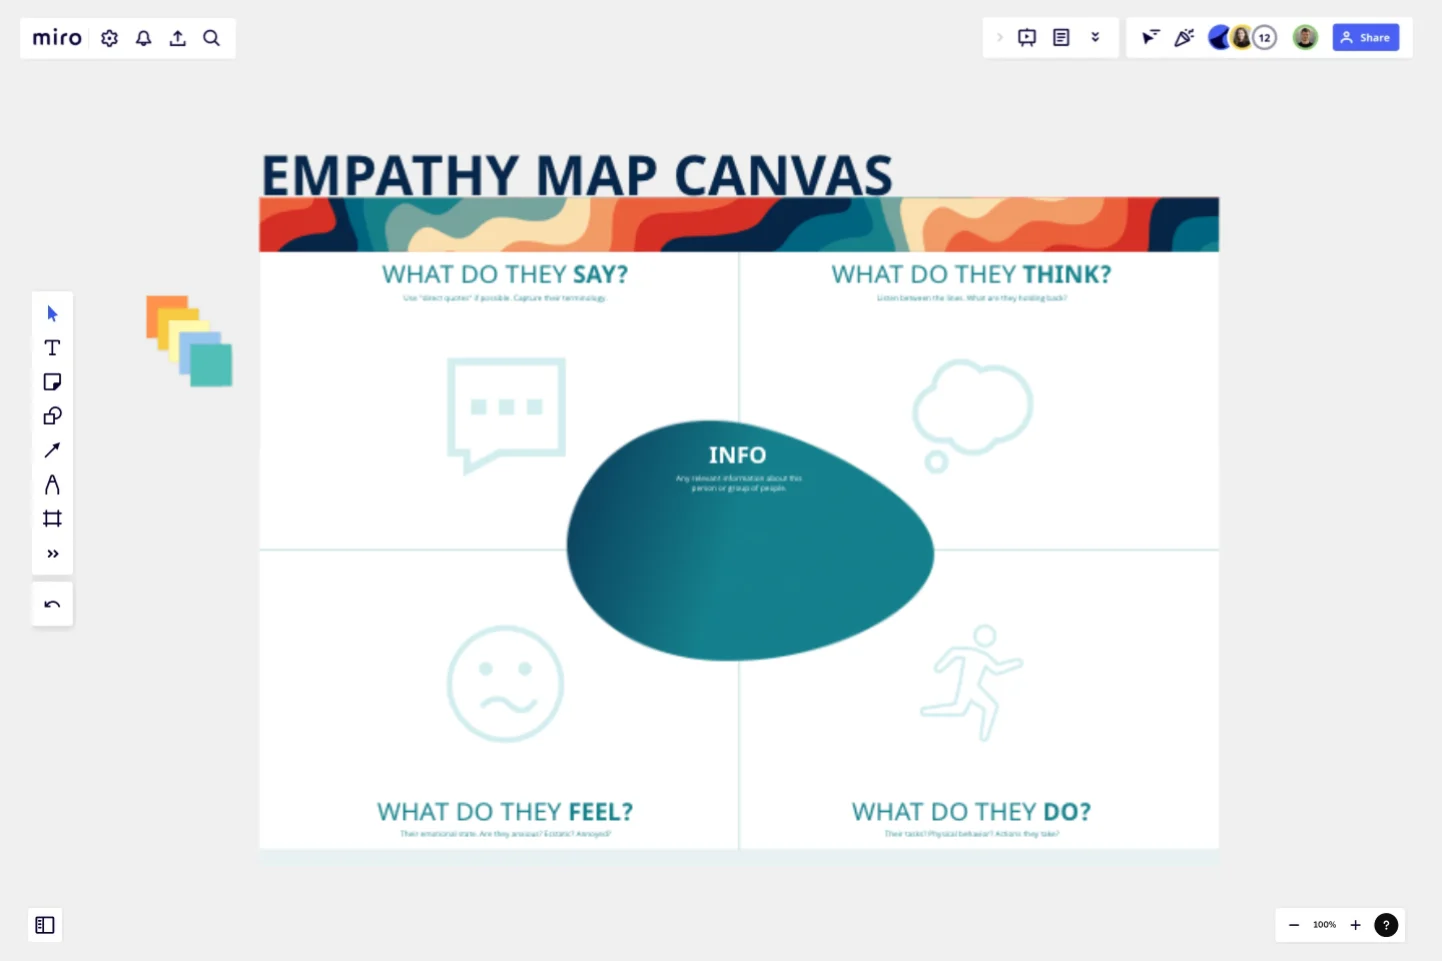
Empathy Map Canvas
In order to create products that truly work for people, we need to first empathize with them...to walk a mile in their shoes...to understand what makes them tick and what ticks them off.
The Empathy Map allows us to experience things from our customers' perspective. This exercise goes well beyond their surface needs (what they say they want) and digs into the latent needs as well as the emotional triggers that drive their behavior and impact the decisions they make.You can build an individual Empathy Map for each person you conduct research with or you can combine multiple people into one, persona-like Empathy Map.
WHY DO IT?
Generate a solid foundation of understanding/empathy for your customers
Garner alignment among your team
Find themes and generate insights for future ideation
Help your core team socialize "Voice of the Customer" outward to stakeholders
Reduce personal bias from your designs
Reveal latent needs that your customers are not aware they have
WORKSHOP PREPARATION:
Works best with 2-4 People
Time: 1-2 hrs depending amount of data & number of maps you're creating
Supplies: This Miro board, an open mind, and some humility!
WORKSHOP FLOW:
1. Start with the data. It could be:
Notes from customer interviews
Feedback gathered from your customer experience team
Observations from watching people interact with you product
Any way you can get first-hand input from customers
2. Add sticky notes to the board:
Break that data down into one thought or concept per sticky note
Place them on the board wherever they make the most sense. Keep in mind that some notes could easily live in more than one spot. Don't sweat it...make a quick decision and keep moving
Everyone should work alone until all notes are arranged on the board
3. Open discussion:
Review the notes and think out loud to spur deeper discussion
Ask questions or challenge placement
Identify gaps in understanding—what else do you need to learn?
What Are We Capturing?
CONTEXT / INFO: Any relevant information about this person or group of people.
WHAT DO THEY SAY? Use "direct quotes" if possible. Capture their terminology.
WHAT DO THEY THINK? Listen between the lines. What are they holding back?
WHAT DO THEY FEEL? Their emotional state. Are they anxious? Ecstatic? Annoyed?
WHAT DO THEY DO? Their tasks? Physical behavior? Actions they take?
THEIR GOALS? What do they want to accomplish? Their 'Jobs To Be Done'?
THEIR PAINS? What frustrates them? What is getting in their way?
ADAPT:
I encourage you to consider how you might add to, or alter, this exercise. Your situation is likely unique. Can you start with your existing personas in the middle? Could you make this entire map centered around uncovering insights for one feature you're experimenting with? Could you add a narrative section to capture a story from each person?The sky is the limit...have some fun and try something new!
This template was created by Pete Fleming.
Get started with this template right now.
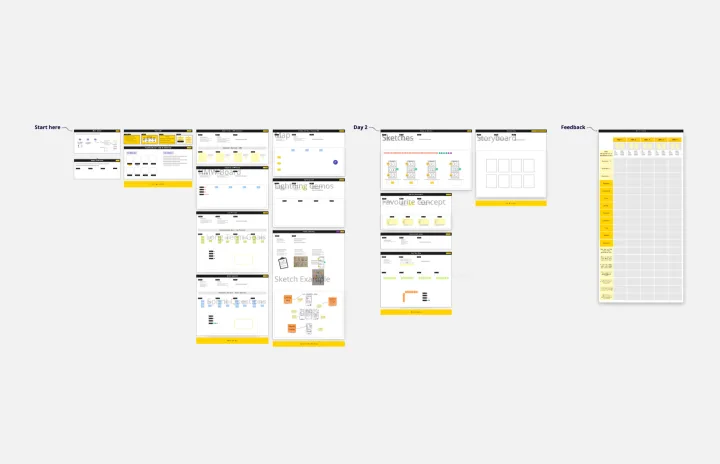
Remote Design Sprint Template
Works best for:
Design, Desk Research, Sprint Planning
A design sprint is an intensive process of designing, iterating, and testing a prototype over a 4 or 5 day period. Design sprints are conducted to break out of stal, work processes, find a fresh perspective, identify problems in a unique way, and rapidly develop solutions. Developed by Google, design sprints were created to enable teams to align on a specific problem, generate multiple solutions, create and test prototypes, and get feedback from users in a short period of time. This template was originally created by JustMad, a business-driven design consultancy, and has been leveraged by distributed teams worldwide.
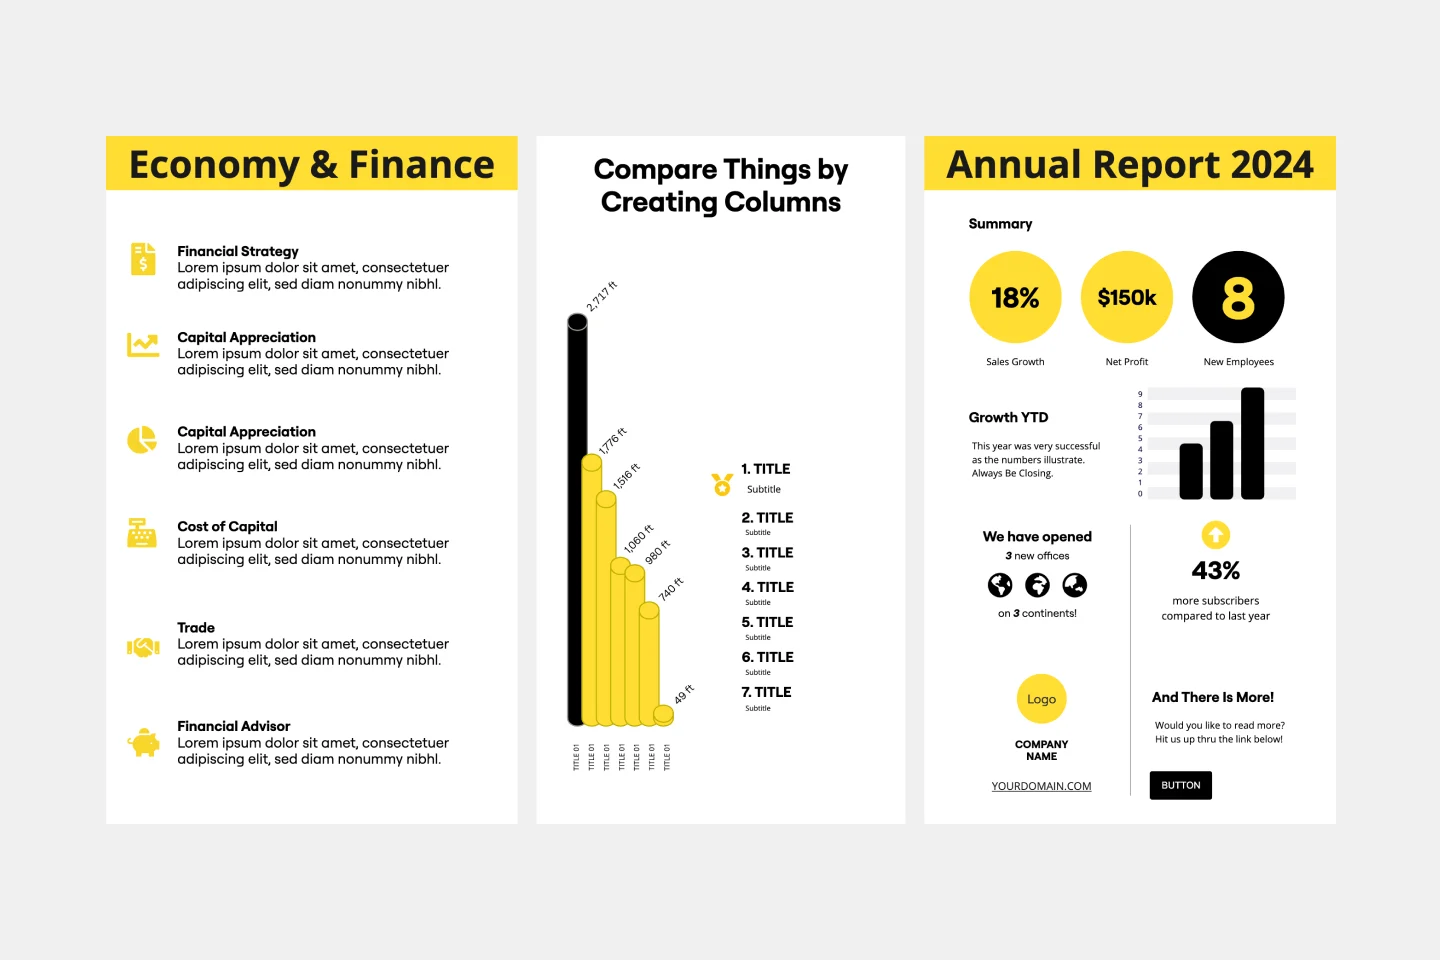
Infographic Template
Works best for:
Marketing, Desk Research, Documentation
As we bet you’ve experienced, data can get pretty dense and dry. But you need it to be compelling, memorable, and understandable. The solution? Infographics. These are tools that let you present information in a visually striking way and turn quantitative or qualitative data into stories that engage and resonate. Whoever you’ll be presenting to — customers, donors, or your own internal teams — our template will let you design an infographic that combines text and visuals to break down even the most complicated data.
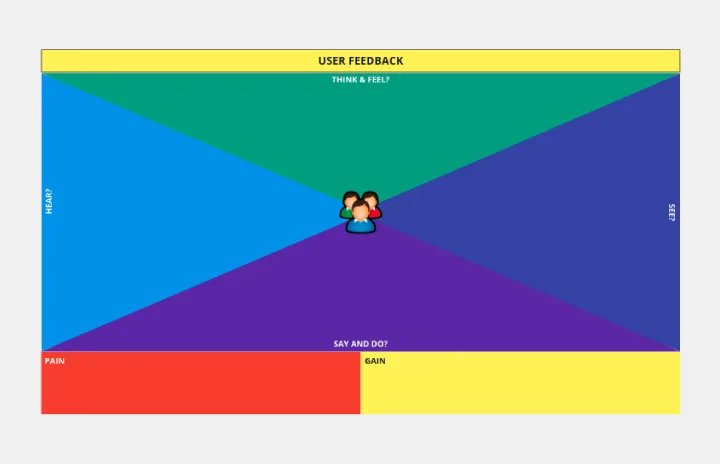
Empathy Map by Pino de Francesco
Works best for:
Research & Design, Market Research
The Empathy Map template helps you understand your users' needs, behaviors, and experiences. By visualizing what users think, feel, see, hear, and do, you can gain deep insights into their motivations and pain points. This template is essential for creating user-centered designs and improving customer experiences.
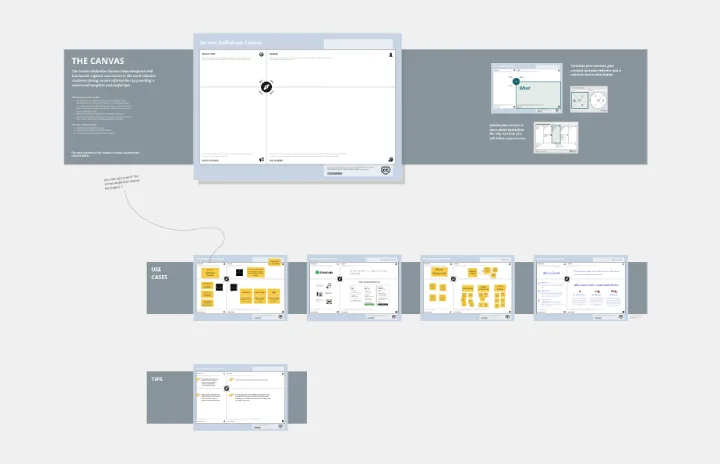
Service Definition Canvas
Works best for:
Research & Design
The Service Definition Canvas helps you define and visualize the core components of your service. This template is perfect for outlining service interactions, identifying improvement areas, and aligning teams. Use it to create a clear and comprehensive service blueprint that enhances customer experience and operational efficiency. It's ideal for strategic planning and ensuring a cohesive understanding of service delivery among stakeholders.
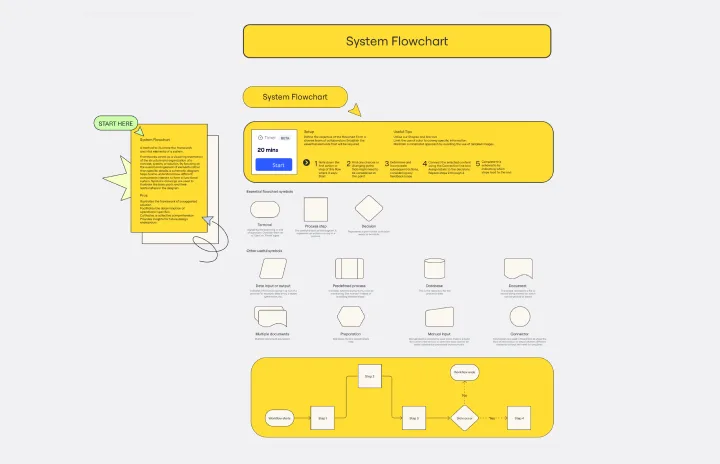
System Flowchart Template
The System Flowchart Template is a visual representation of the structure and organization of a concept, system, or solution. It helps teams understand how different components interact to form a functional system by focusing on the overall arrangement of elements rather than specific details. Symbolic drawings are used to illustrate the basic parts and their relationships in the diagram.
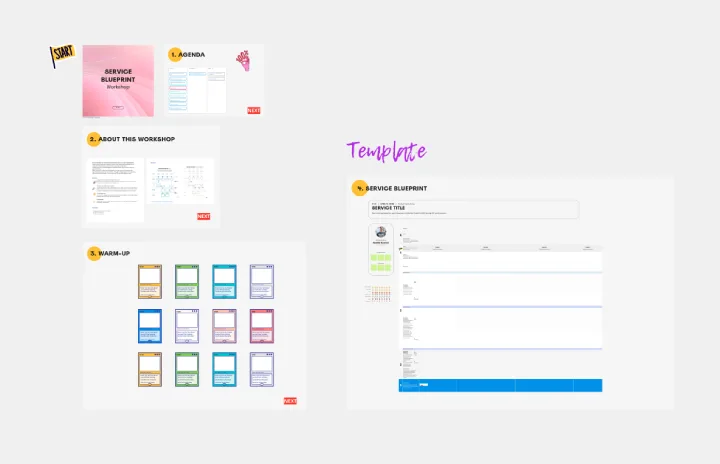
Service Blueprint Workshop
Works best for:
Research & Design
The Service Blueprint Workshop by Lidia Olszewska is designed for collaborative service design sessions. This template helps teams visualize service processes, identify pain points, and brainstorm solutions. Use it to align cross-functional teams, improve service delivery, and ensure a seamless customer experience. It's ideal for workshops aimed at service optimization, fostering collaboration, and strategic planning in service design.