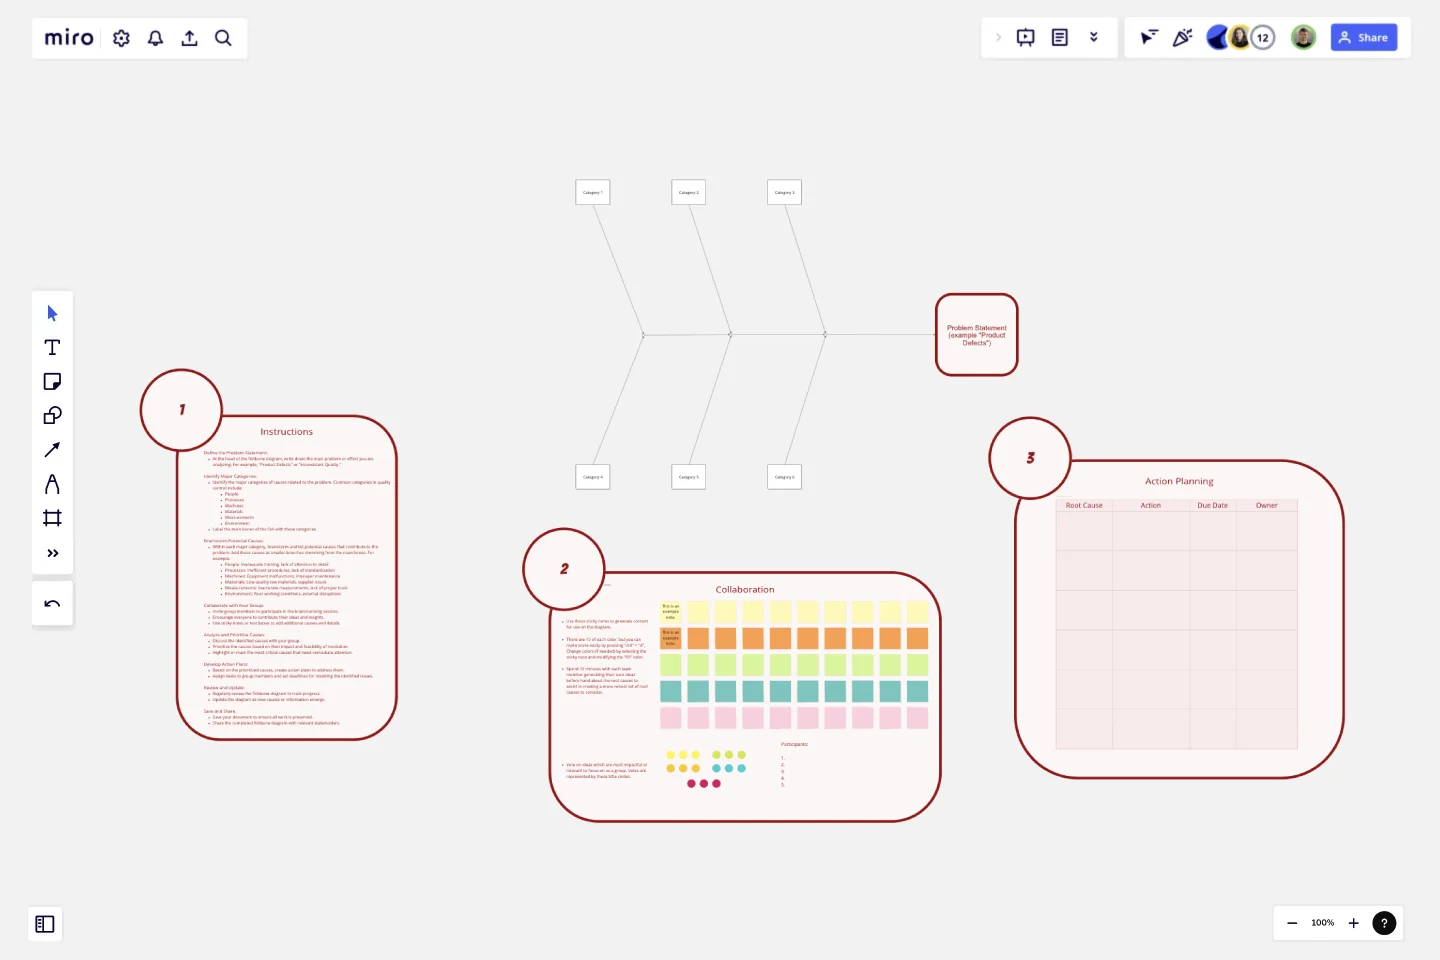
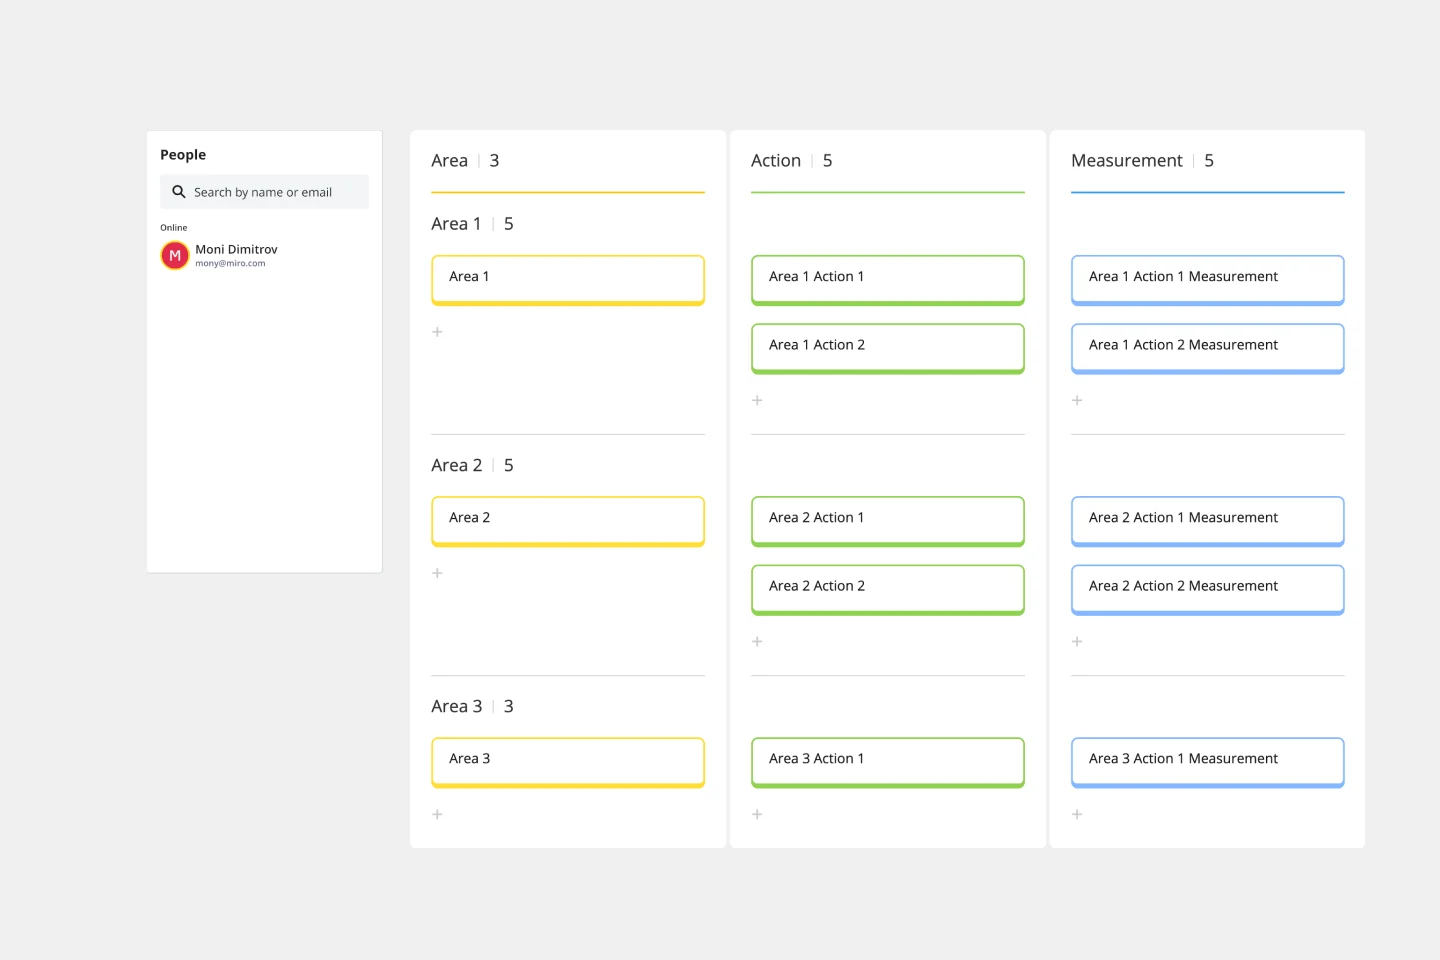
Fishbone Diagram for Quality Control
The Fishbone Diagram for Quality Control template is a specialized tool designed to help quality control teams systematically analyze and identify the root causes of quality-related issues.
Here’s why you should consider using this template:
Key Features:
Problem-Centric Design:
The diagram starts with a clear definition of the problem or effect you are addressing, such as "Product Defects" or "Inconsistent Quality," providing a focused approach to problem-solving.
Major Categories:
The template includes predefined categories relevant to quality control, such as People, Processes, Machines, Materials, Measurements, and Environment. These categories help in organizing potential causes systematically.
Structured Brainstorming:
Each category has branches for listing potential causes, encouraging thorough brainstorming and ensuring that no aspect of the quality control process is overlooked.
Collaborative Framework:
The template is designed for team collaboration, allowing multiple users to contribute their insights and ideas in a structured manner, fostering a comprehensive analysis.
Visual Clarity:
The fishbone (Ishikawa) diagram's visual structure makes it easy to understand the relationships between the problem and its potential causes, facilitating better communication and discussion among team members.
Why Use This Template?
Systematic Problem Analysis:
The Fishbone Diagram for Quality Control template helps in systematically breaking down complex problems into manageable parts, making it easier to identify root causes.
Holistic View:
By considering multiple categories, the template ensures that all possible aspects of the quality control process are examined, leading to a more thorough investigation.
Improved Collaboration:
The template promotes team collaboration, ensuring that diverse perspectives are considered, which can lead to more innovative solutions and a better understanding of the problem.
Enhanced Decision-Making:
The structured approach of the template aids in prioritizing causes based on their impact, helping teams focus on the most critical areas first, thus improving decision-making and action planning.
Effective Communication:
The visual nature of the fishbone diagram makes it easier to communicate findings and strategies to stakeholders, ensuring that everyone is on the same page.
By using the Fishbone Diagram for Quality Control template, teams can effectively analyze quality control issues, identify root causes, and develop targeted action plans to improve product quality and process consistency.
This template was created by Anthony.
Get started with this template right now.
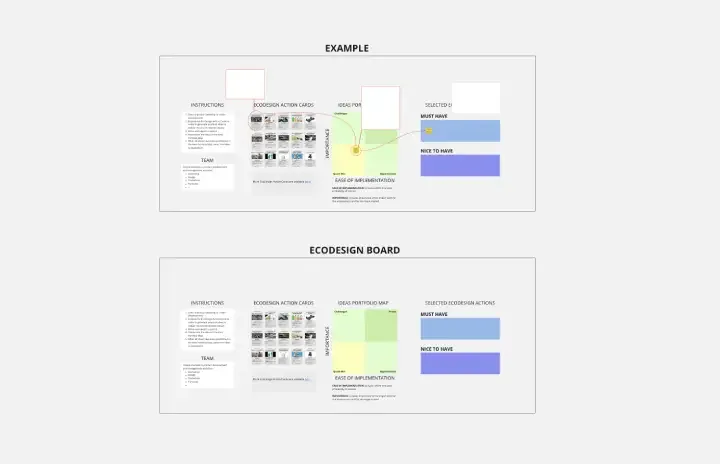
Sustainable Product Innovation Board
Works best for:
Product Management, Planning
The Sustainable Product Innovation Board template supports sustainable product development practices. By integrating sustainability criteria into product ideation, design, and implementation processes, this template fosters eco-friendly product innovation. With sections for evaluating environmental impacts and setting sustainability goals, it enables teams to create products that minimize ecological footprints and promote social responsibility. This template serves as a framework for driving sustainable business practices and meeting consumer demands for environmentally conscious products.
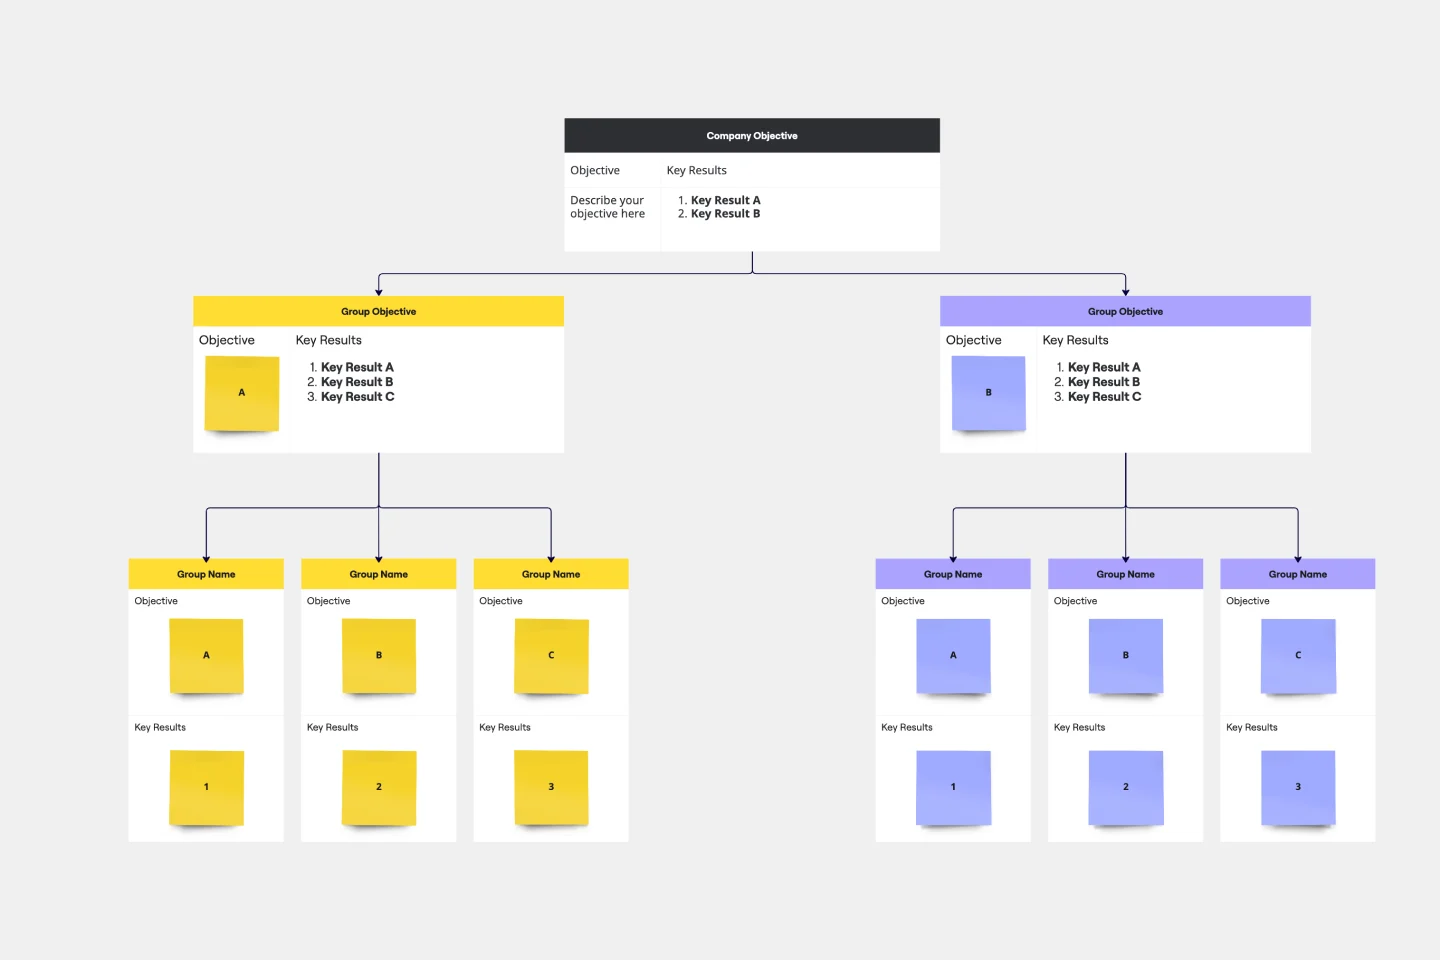
Objectives and Key Results (OKRs) Template
Works best for:
Leadership, Strategic Planning, Project Planning
Clarity, focus, and structure — those are the key ingredients to feeling confident in your company’s directions and decisions, and an OKR framework is designed to give them to you. Working on two main levels — strategic and operational — OKRs (short for objectives and key results) help an organization’s leaders determine the strategic objectives and define quarterly key results, which are then connected to initiatives. That’s how OKRs empower teams to focus on solving the most pressing organizational problems they face.
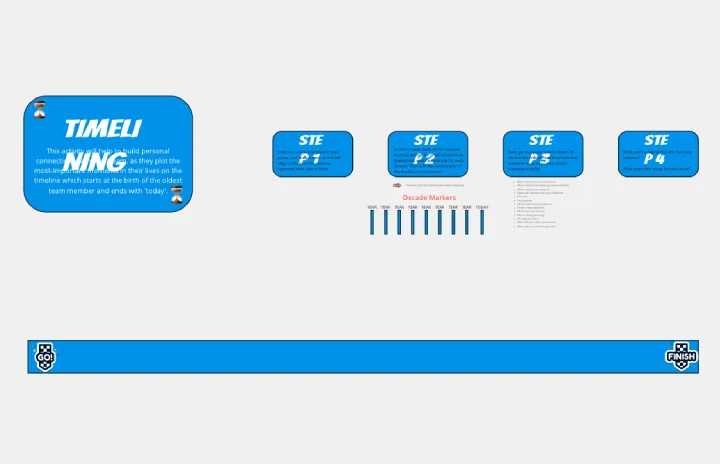
Timelining
Works best for:
Planning, Timeline
Timelining is a versatile template designed for creating detailed project timelines. It allows you to outline tasks, milestones, and deadlines, helping you manage projects efficiently. Whether for business or personal use, this template ensures you stay organized and on schedule.
Corrective Action Plan Template
Works best for:
Project Management, Operations, Strategic Planning
For a manager or HR leader, it’s the least fun part of the job: Documenting an employee’s performance issues and talking about them directly to that employee. A corrective action plan makes that tough task a little easier by putting issues into a professional, written framework. That way the process, next steps, and details of the conversations are all clearly documented. This template will enable you to eliminate murky communication, align on expectations, and provide step-by-step instructions for your employee.
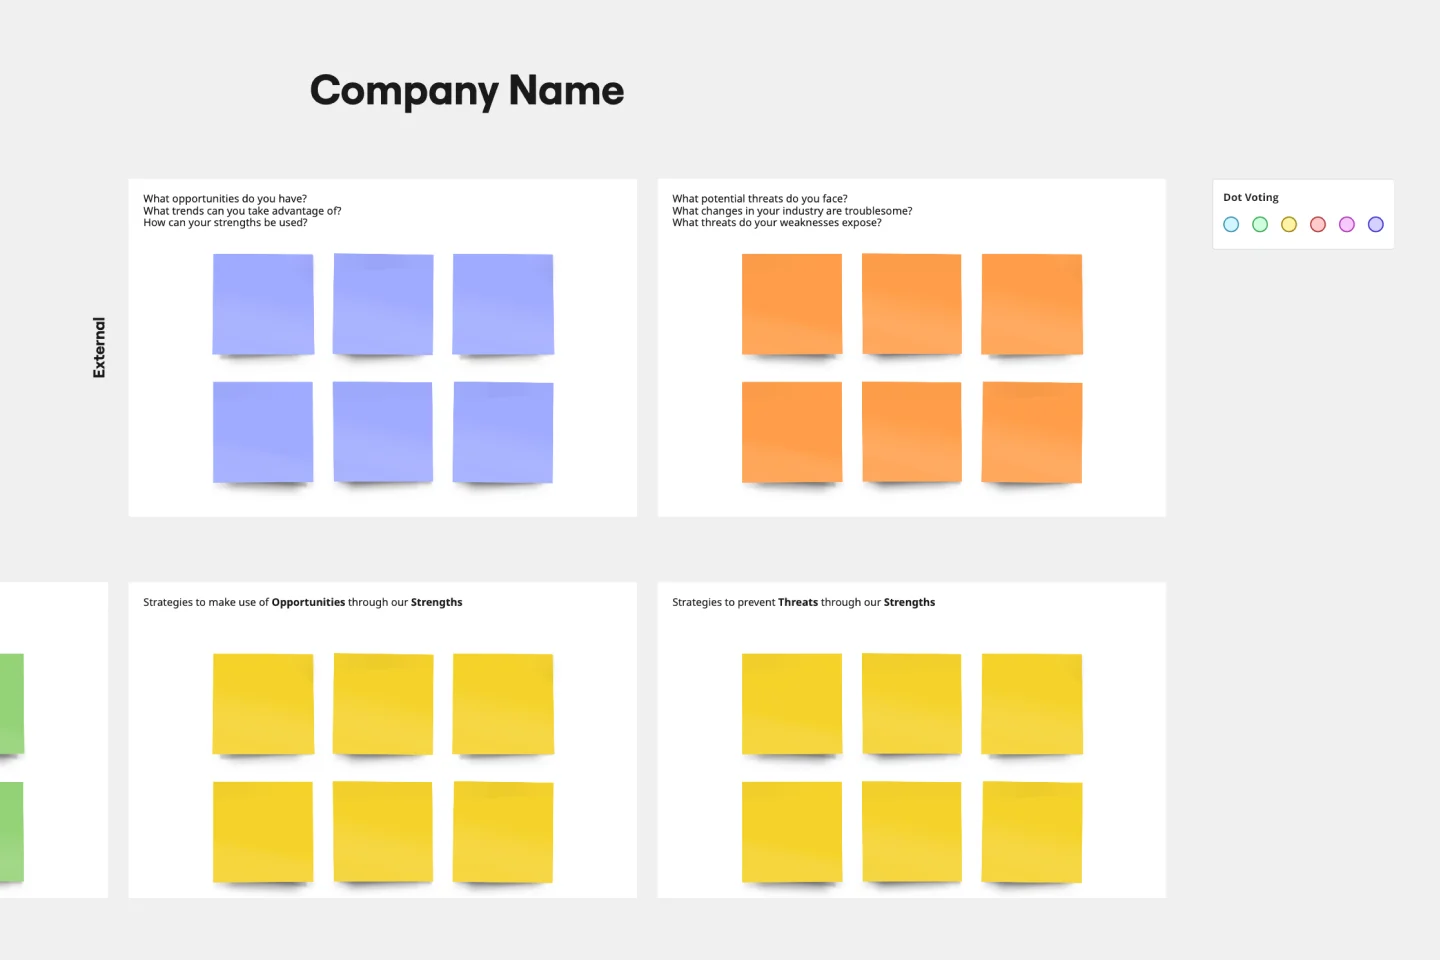
SWOT Analysis Template
Works best for:
Decision Making, Strategic Planning, Prioritization
When you’re developing a business strategy, it can be hard to figure out what to focus on. A SWOT analysis helps you hone in on key factors. SWOT stands for Strengths, Weaknesses, Opportunities, and Threats. Strengths and weaknesses are internal factors, like your employees, intellectual property, marketing strategy, and location. Opportunities and threats are usually external factors, like market fluctuations, competition, prices of raw materials, and consumer trends. Conduct a SWOT analysis whenever you want to explore opportunities for new businesses and products, decide the best way to launch a product, unlock your company’s potential, or use your strengths to develop opportunities.
The Product Hunt
Works best for:
Product Management, Planning
The Product Hunt template provides a platform for collecting and prioritizing product ideas. By allowing teams to submit, review, and vote on ideas, this template fosters a culture of innovation and collaboration. With features for categorizing ideas, tracking progress, and celebrating successes, it promotes transparency and engagement across teams. This template serves as a central hub for capturing and nurturing innovative ideas, driving continuous improvement and product innovation.