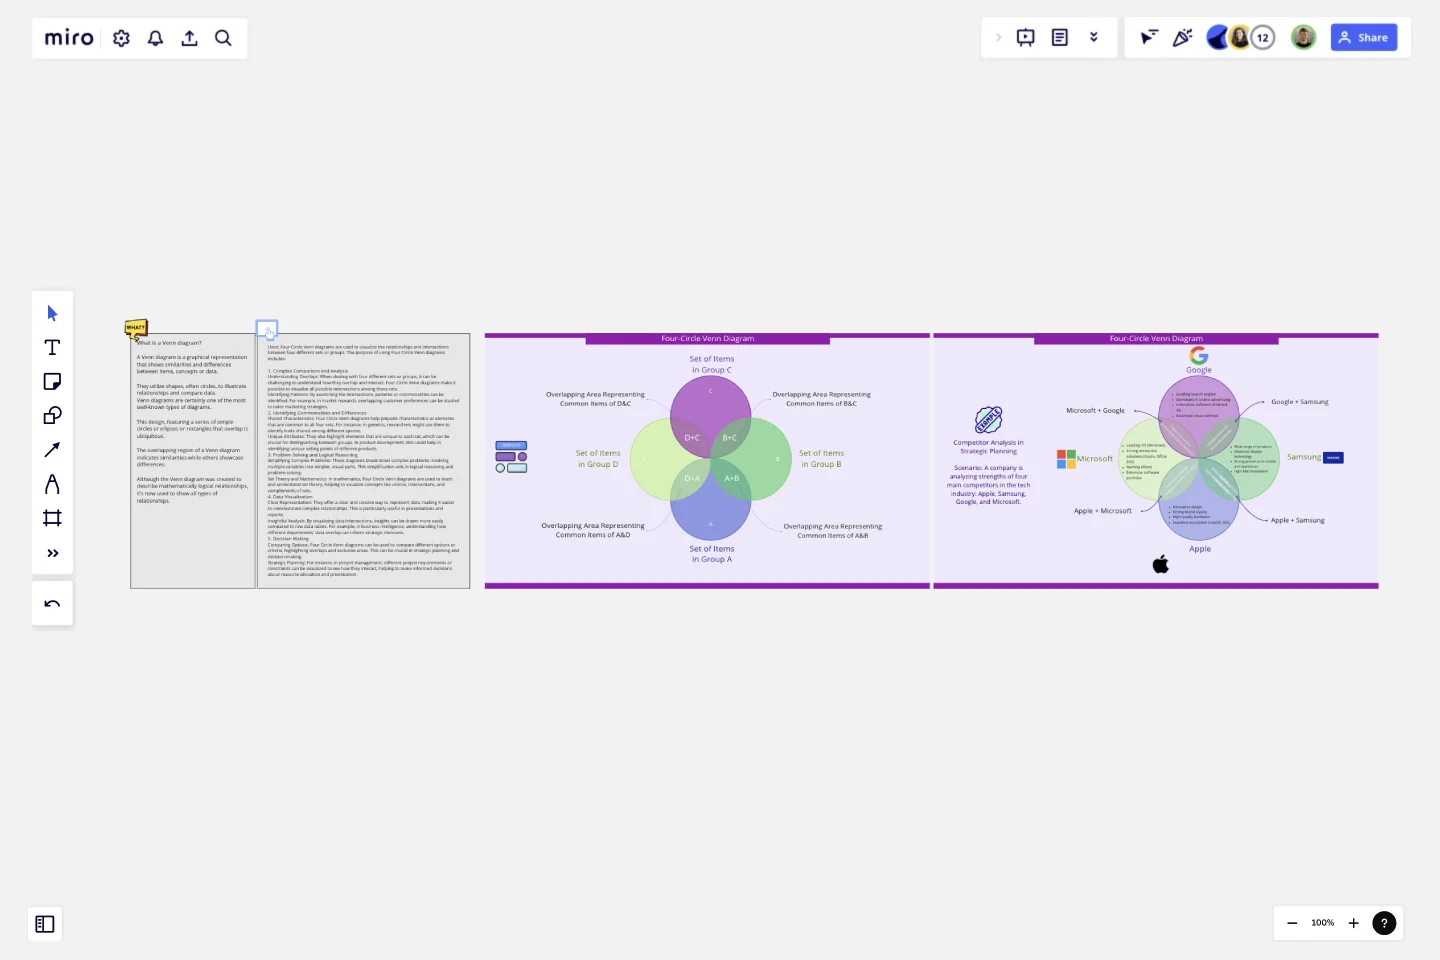
Four-Circle Venn Diagram
A Venn diagram is a graphical representation that shows similarities and differences between items, concepts or data.
They utilize shapes, often circles, to illustrate relationships and compare data.
Venn diagrams are certainly one of the most well-known types of diagrams. This design, featuring a series of simple circles or ellipses or rectangles that overlap is ubiquitous. The overlapping region of a Venn diagram indicates similarities while others showcase differences. Although the Venn diagram was created to describe mathematically logical relationships, it’s now used to show all types of relationships.
Uses:
Four Circle Venn diagrams are used to visualize the relationships and intersections between four different sets or groups. The purpose of using Four Circle Venn diagrams includes:
1. Complex Comparison and AnalysisUnderstanding Overlaps: When dealing with four different sets or groups, it can be challenging to understand how they overlap and interact. Four Circle Venn diagrams make it possible to visualize all possible intersections among these sets.
Identifying Patterns: By examining the intersections, patterns or commonalities can be identified. For example, in market research, overlapping customer preferences can be studied to tailor marketing strategies.
2. Identifying Commonalities and DifferencesShared Characteristics: Four Circle Venn diagrams help pinpoint characteristics or elements that are common to all four sets. For instance, in genetics, researchers might use them to identify traits shared among different species.
Unique Attributes: They also highlight elements that are unique to each set, which can be crucial for distinguishing between groups. In product development, this could help in identifying unique selling points of different products.
3. Problem Solving and Logical ReasoningSimplifying Complex Problems: These diagrams break down complex problems involving multiple variables into simpler, visual parts. This simplification aids in logical reasoning and problem-solving.
Set Theory and Mathematics: In mathematics, Four Circle Venn diagrams are used to teach and understand set theory, helping to visualize concepts like unions, intersections, and complements of sets.
4. Data VisualizationClear Representation: They offer a clear and concise way to represent data, making it easier to communicate complex relationships. This is particularly useful in presentations and reports.
Insightful Analysis: By visualizing data intersections, insights can be drawn more easily compared to raw data tables. For example, in business intelligence, understanding how different departments' data overlap can inform strategic decisions.
5. Decision MakingComparing Options: Four Circle Venn diagrams can be used to compare different options or criteria, highlighting overlaps and exclusive areas. This can be crucial in strategic planning and decision-making.
Strategic Planning: For instance, in project management, different project requirements or constraints can be visualized to see how they interact, helping to make informed decisions about resource allocation and prioritization. Learn from the examples provided to start your own Venn diagram.
This template was created by Khawaja Rizwan.
Get started with this template right now.
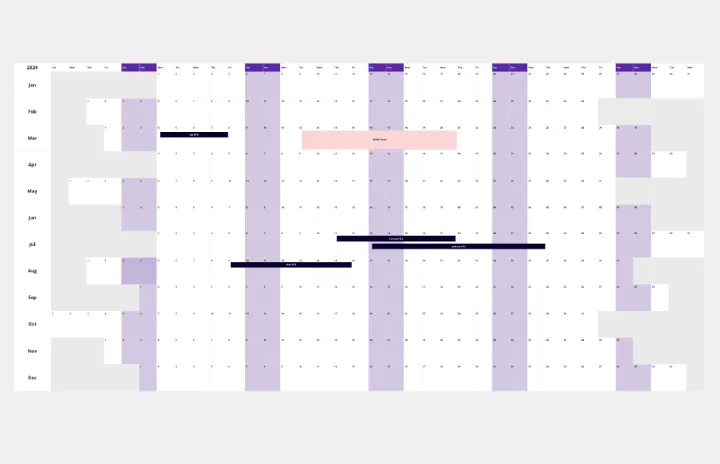
Calendar 2024 - a Year timeline
Works best for:
Strategy, Planning
The Calendar 2024 a year Timeline template is perfect for planning and organizing your year. It helps you schedule important dates, track annual goals, and stay on top of deadlines. This template ensures you have a clear overview of your year ahead.
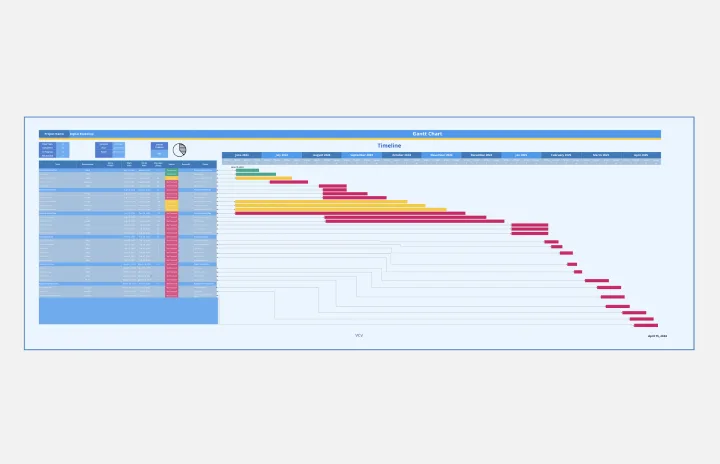
Gantt Chart Project
Works best for:
Strategy, Planning
The Gantt Chart Project template is a versatile tool for managing various types of projects. It provides a clear visual timeline of your project's tasks, deadlines, and dependencies. Use it to plan, execute, and monitor your project's progress, ensuring all activities are aligned and on track. This template enhances team collaboration, improves time management, and helps address potential bottlenecks for successful outcomes.
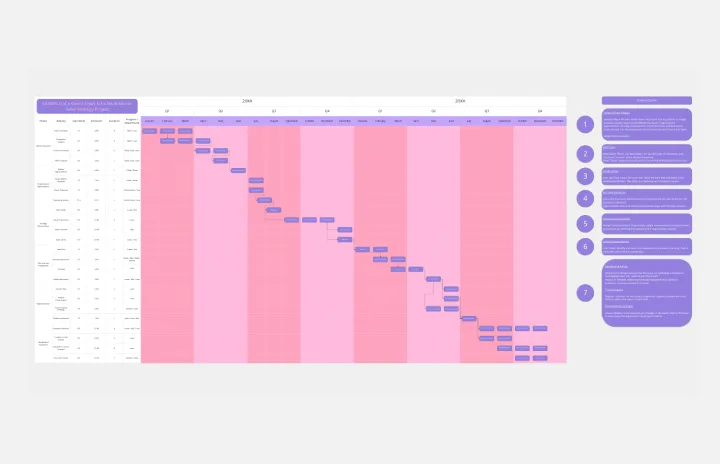
Sales Strategy Gantt Chart
Works best for:
Strategy, Planning
Creating and executing a sales strategy requires meticulous planning. The Sales Strategy Gantt Chart template helps you map out every step of your strategy, from goal setting to implementation and review. Visualize key activities, set timelines, and assign tasks to ensure your sales team stays focused and aligned. This template enables you to track progress, measure performance, and make data-driven adjustments for better sales outcomes.
Work Breakdown Structure Template
Works best for:
Project Management, Mapping, Workflows
A work breakdown is a project management tool that lays out everything you must accomplish to complete a project. It organizes these tasks into multiple levels and displays each element graphically. Creating a work breakdown is a deliverable-based approach, meaning you’ll end up with a detailed project plan of the deliverables you must create to finish the job. Create a Work Breakdown Structure when you need to deconstruct your team's work into smaller, well-defined elements to make it more manageable.
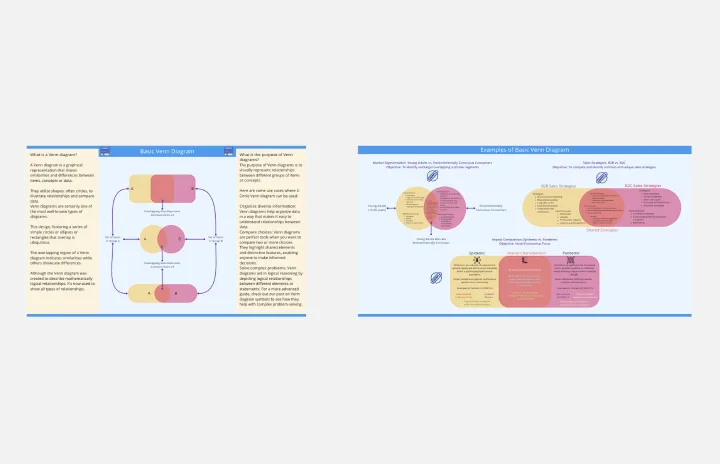
Basic Venn Diagram
Works best for:
Venn Diagram
The Basic Venn Diagram template is a simple yet powerful tool for visualizing relationships between different sets. Use it to compare and contrast concepts, identify commonalities and differences, and organize information logically. This template is perfect for brainstorming, teaching, and presentations, making complex information more accessible and understandable. Ideal for educators, students, and professionals in various fields.
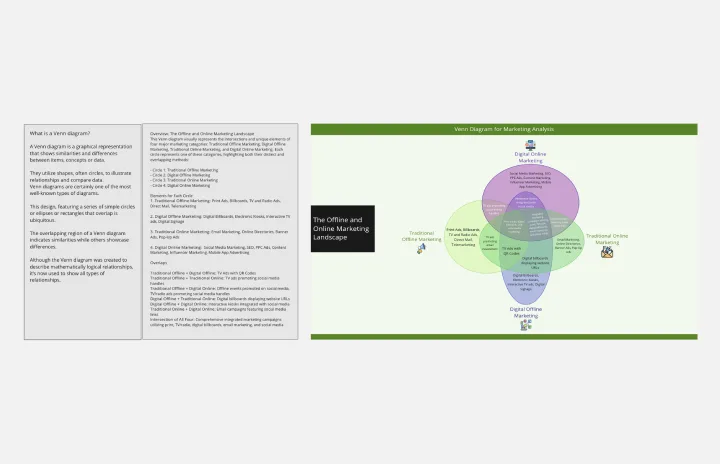
Venn Diagram for Marketing Analysis
Works best for:
Venn Diagram
Optimize your marketing strategies with the Venn Diagram for Marketing Analysis template. Use it to compare different market segments, identify overlapping interests, and analyze competitive landscapes. This tool helps you visualize data, uncover insights, and make informed marketing decisions. Perfect for marketing professionals, strategists, and business analysts looking to enhance their marketing analysis and planning efforts through visual tools.