Impact Mapping Template
Set business goals and outline how to achieve them.
About the Impact Mapping template
What is Impact Mapping?
Impact mapping is a strategic planning technique. It allows organizations to stay on track while building products and shipping goods and services. An impact map is a graphical representation of your goals and the steps you must take to deliver on them. By creating an impact map, you can clearly communicate with your teammates, align on business objectives, and build better roadmaps.
When building products or working on projects, it can be easy to lose sight of your role within the broader organization. But your projects have a dynamic relationship with everything else in the organization, including other projects, teams, products, and functions. Many planning techniques lack this big-picture view. Impact maps, by contrast, help you visualize the relationship between your project roadmaps and the rest of your organization. You can therefore capture key assumptions and scope so you can deliver solutions without waste or over-engineering.
When should you use Impact Mapping?
You can use Impact Mapping to help you decide what should be in a product, prove to a client that it’s not worth investing in a particular feature and plan your next sprint or release. You can also use Impact Mapping for any type of project planning.
What are the key steps of Impact Mapping?
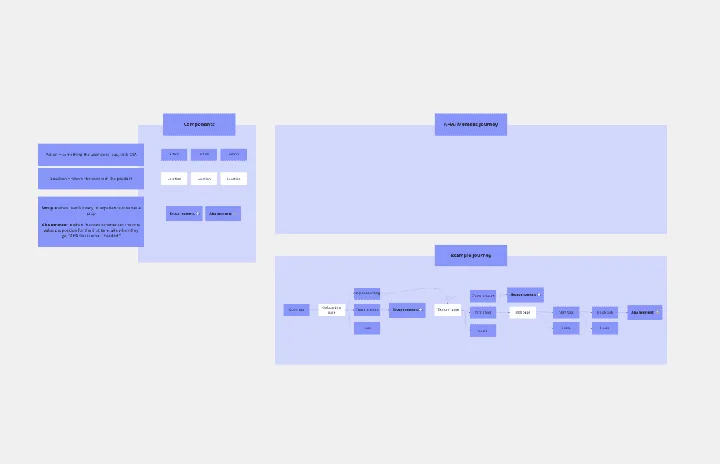
Impact Mapping is generally broken into 4 key steps: setting and describing business goals, identifying the personas, defining the actions these personas will take, and brainstorming the deliverables that will prompt these actions to take place.
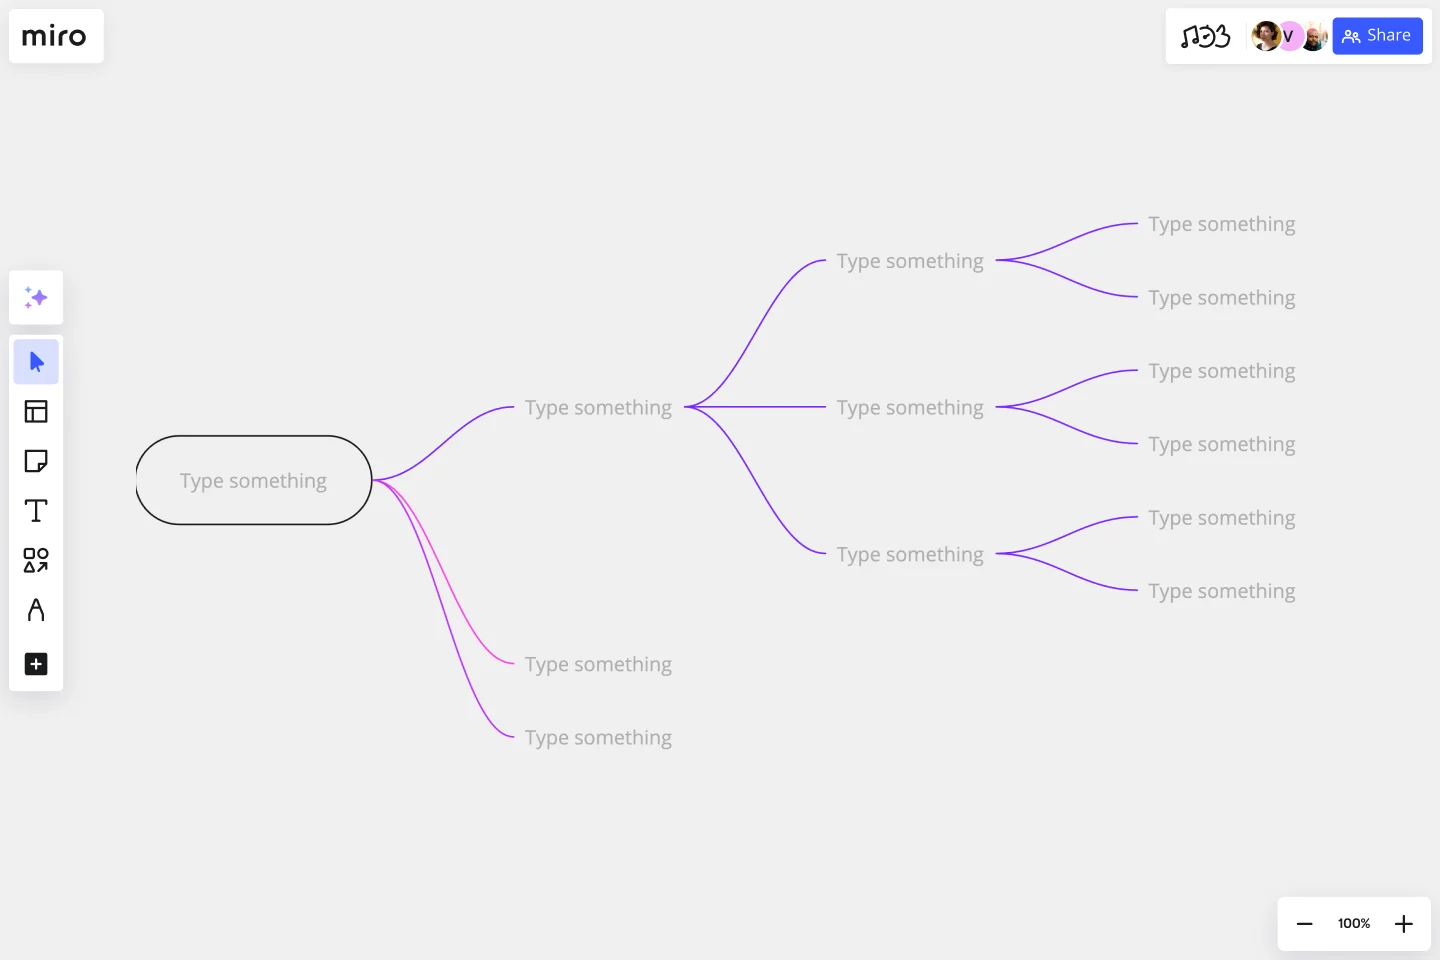
How do you create an Impact Map?
Creating an impact map is simple and easy to do if you follow these steps. You can use our Impact Mapping Template and discuss everything with your team in real-time using Miro’s virtual collaboration platform.
Step 1: Decide on your goals
Start by drawing a box that contains your goal. Why are we doing this project? What do we hope to achieve?
Step 2: Identify the actors
Draw a branch that links your goal to your next box: the actors. Who can produce the effect we’re looking for? Who can obstruct who? Who are our customers or users? Who will be impacted by our goal? Many people choose to have a box for each actor. Connect each box to your goal.
Step 3: Determine the impacts or actions
The second branch brings the impact of your goal into sharper focus. How should our actors’ behavior change as a result of this goal? How can they help us achieve our goal? How might they prevent us from achieving our goal? Draw a box for each potential impact and connect them to your actors.
Step 4: Define the deliverables
Once you have answered those questions, you can start thinking about the scope of your project. The third branch of the map deals with deliverables. What can we do to increase the likelihood that this goal will be achieved? How do we support the desired impact? These are your deliverables -- what you can hope to achieve within the scope of this project.
Get started with this template right now.
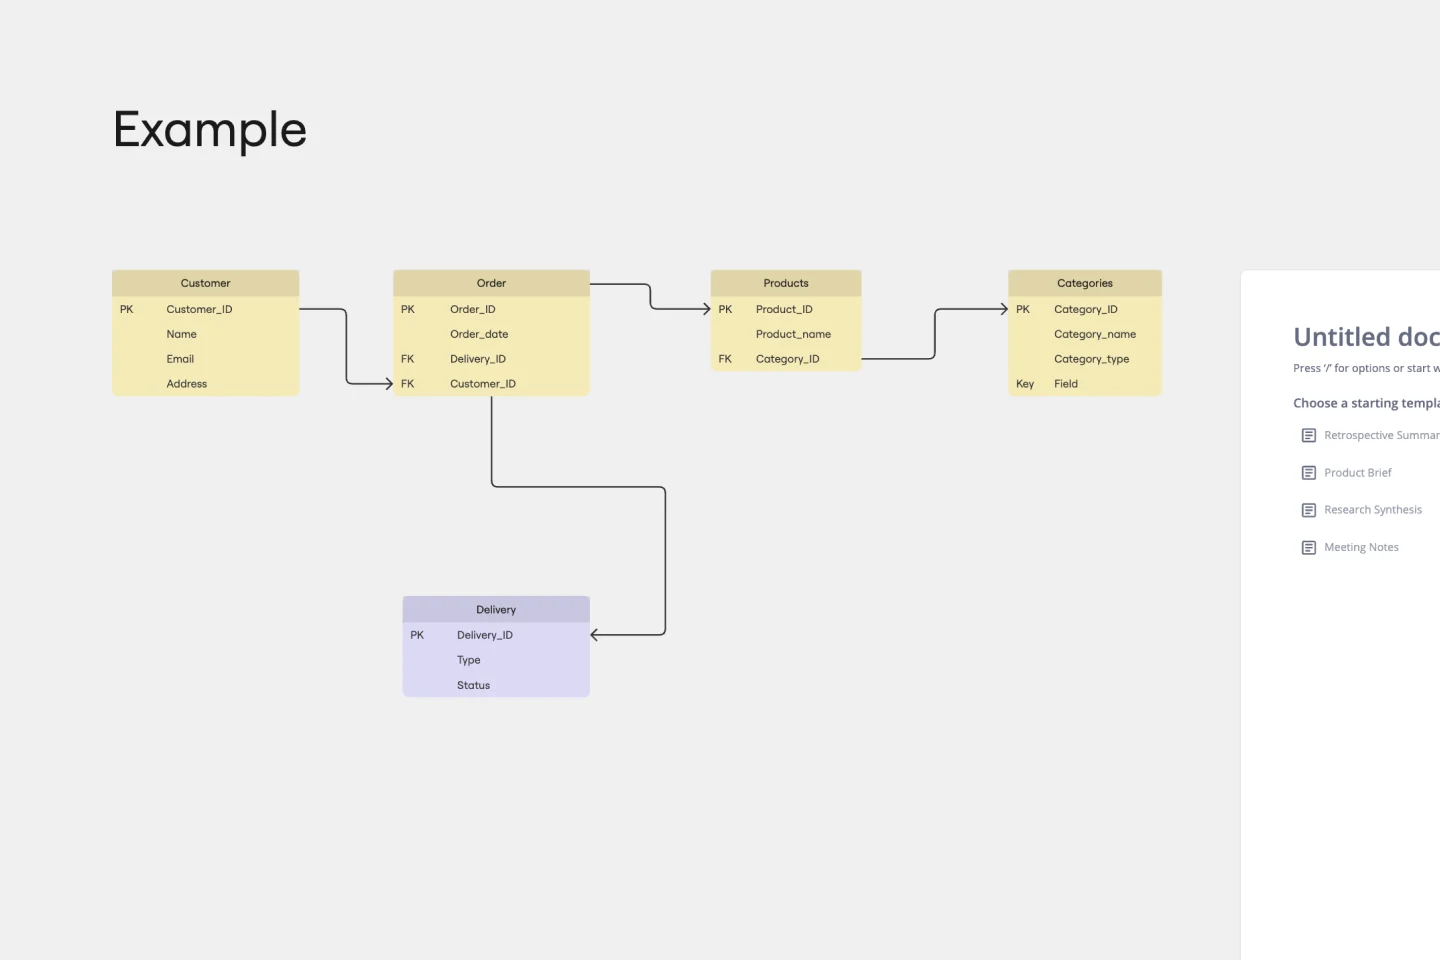
Entity Relationship Diagram Template
Works best for:
Flowcharts, Strategic Planning, Diagrams
Sometimes the most important relationships in business are the internal ones—between the teams, entities, and actors within a system. An entity relationship diagram (ERD) is a structural diagram that will help you visualize and understand the many complex connections between different roles. When will an ERD come in handy? It’s a great tool to have for educating and onboarding new employees or members of a team, and our template makes it so easy to customize according to your unique needs.
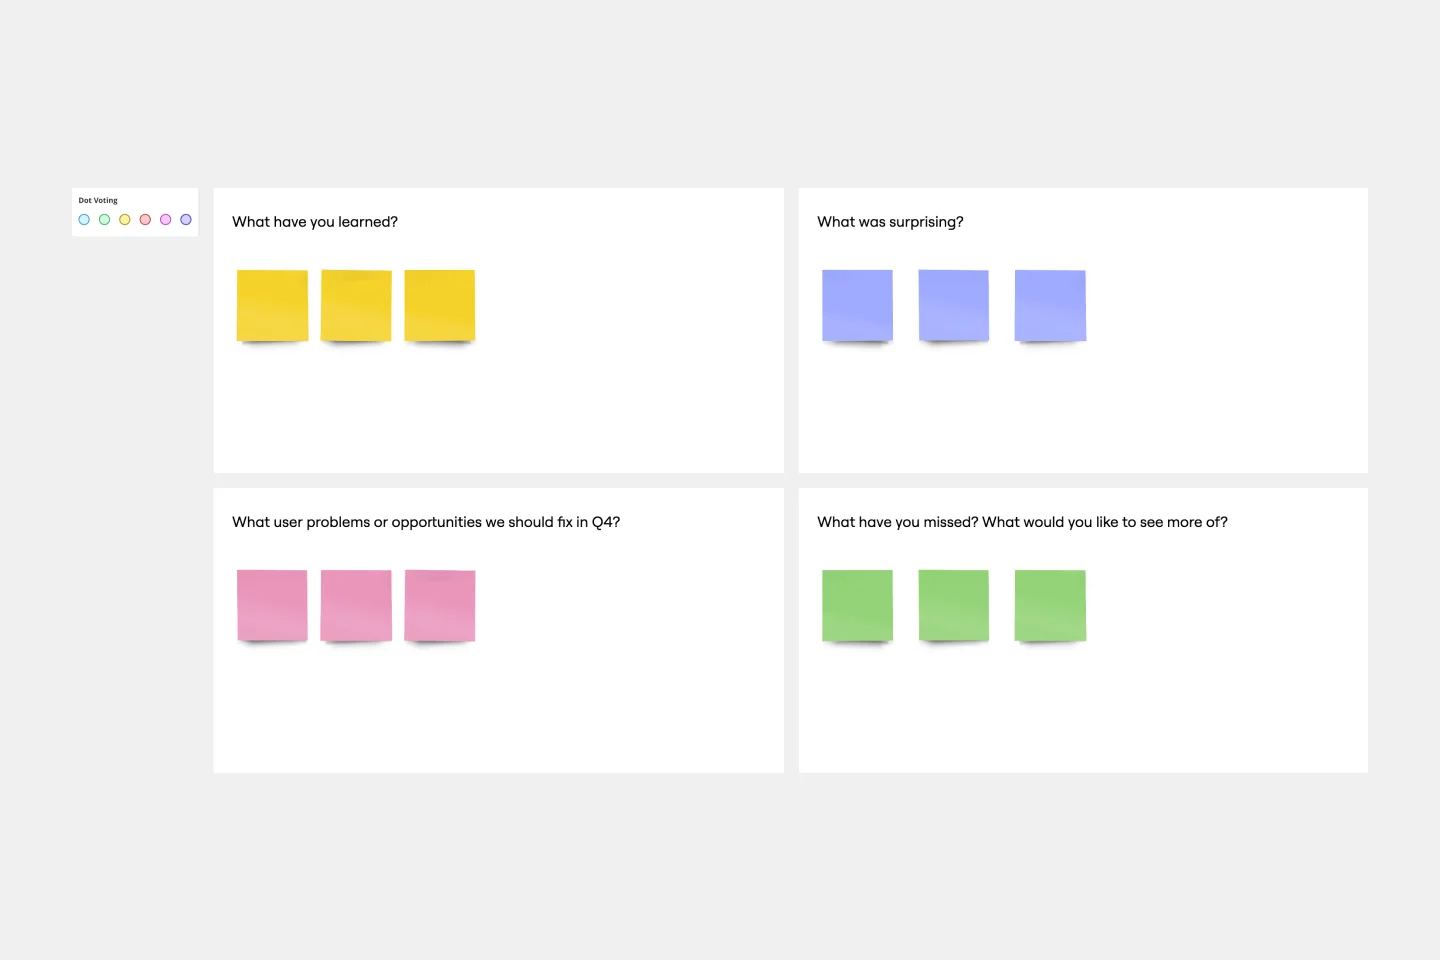
Meeting Reflection Template
Works best for:
Meetings, Brainstorming, Team Meetings
When schedules get hectic, “learning by doing” becomes the default way to learn. So make time for your team to learn in other valuable ways — by reflecting and listening. Led by “learners,” (team members who share with the rest of the team), a meeting reflection lets teammates share new information about a client’s business or an internal business initiative, offer problem-solving techniques, or even recommend books or podcasts worth checking out. Meeting reflections also encourage colleagues at all levels to engage in each other’s professional development of their teammates.
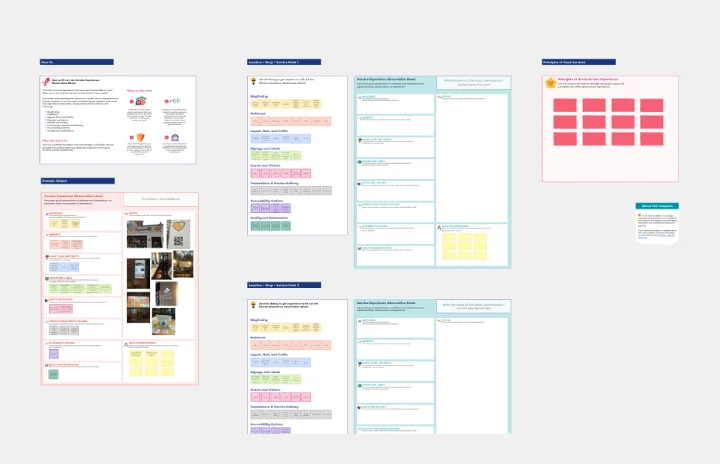
Service Experience Observation Sheet
Works best for:
Research & Design
The Expanded Service Blueprint provides a detailed view of your service processes and interactions. This template is ideal for comprehensive service analysis and improvement. Use it to align teams, visualize the customer journey, and identify opportunities for optimization. It's perfect for enhancing service delivery, fostering collaboration, and ensuring a seamless and efficient service experience for your customers.
AHA! Moment Flowchart
Works best for:
Mapping, Flowcharts
The AHA! Moment Flowchart template offers a visual tool for mapping out the journey of users or customers and identifying key moments of realization or insight (AHA moments). It provides a structured framework for documenting user interactions, emotions, and pain points throughout their journey. This template enables teams to understand user experiences, identify opportunities for improvement, and enhance product or service offerings. By promoting empathy and customer-centric design, the AHA! Moment Flowchart empowers organizations to create meaningful and impactful user experiences effectively.
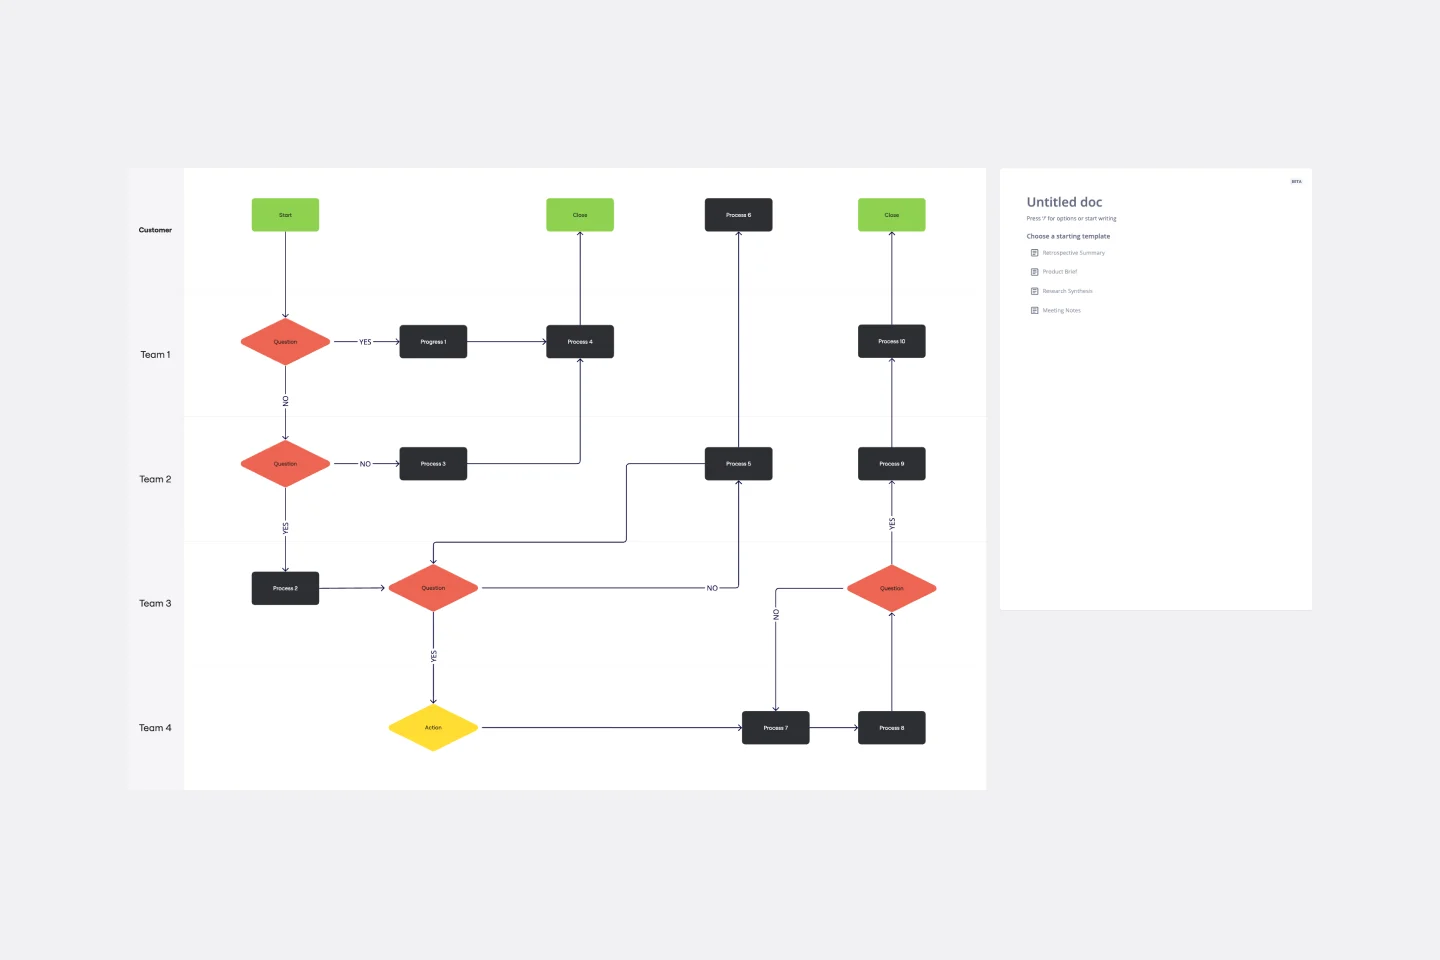
Cross Functional Flowchart
Works best for:
Org Charts, Business Management
Have a quick look at everyone on a project and see exactly what they’ll contribute. That’s the clarity and transparency a cross-functional flowchart will give you. These are also called “swim lane” flowcharts because each person (each customer, client, or representative from a specific function) is assigned a lane—a clear line—that will help you visualize their roles at each stage of the project. This template will empower you to streamline processes, reduce inefficiencies, and make meaningful cross-functional relationships.
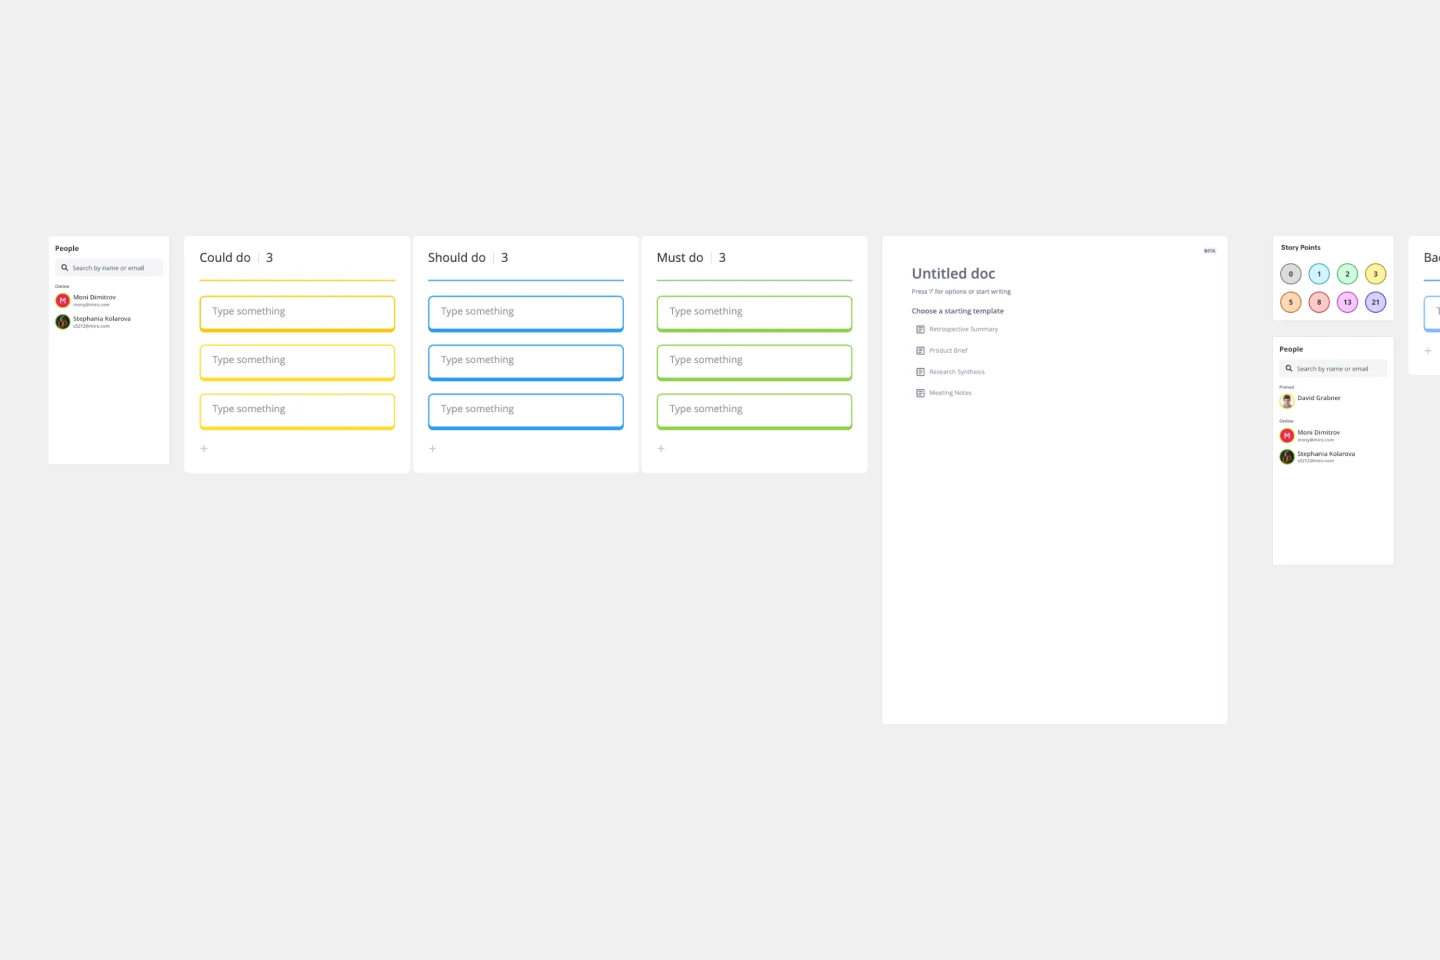
Idea Funnel Backlog
Works best for:
Design, Brainstorming, Agile Workflows
An Idea Funnel Backlog enables you to visualize your backlog and restrict the number of backlogged items at the top. In doing sos, you can prioritize items on your list without having to engage in unnecessary meetings or create too much operational overhead. To use the Idea Funnel Backlog, break up the funnel into different phases or treat it like a roadmap. Use the Idea Funnel Backlog as a hybrid model that combines your roadmap and backlog into one easily digestible format.