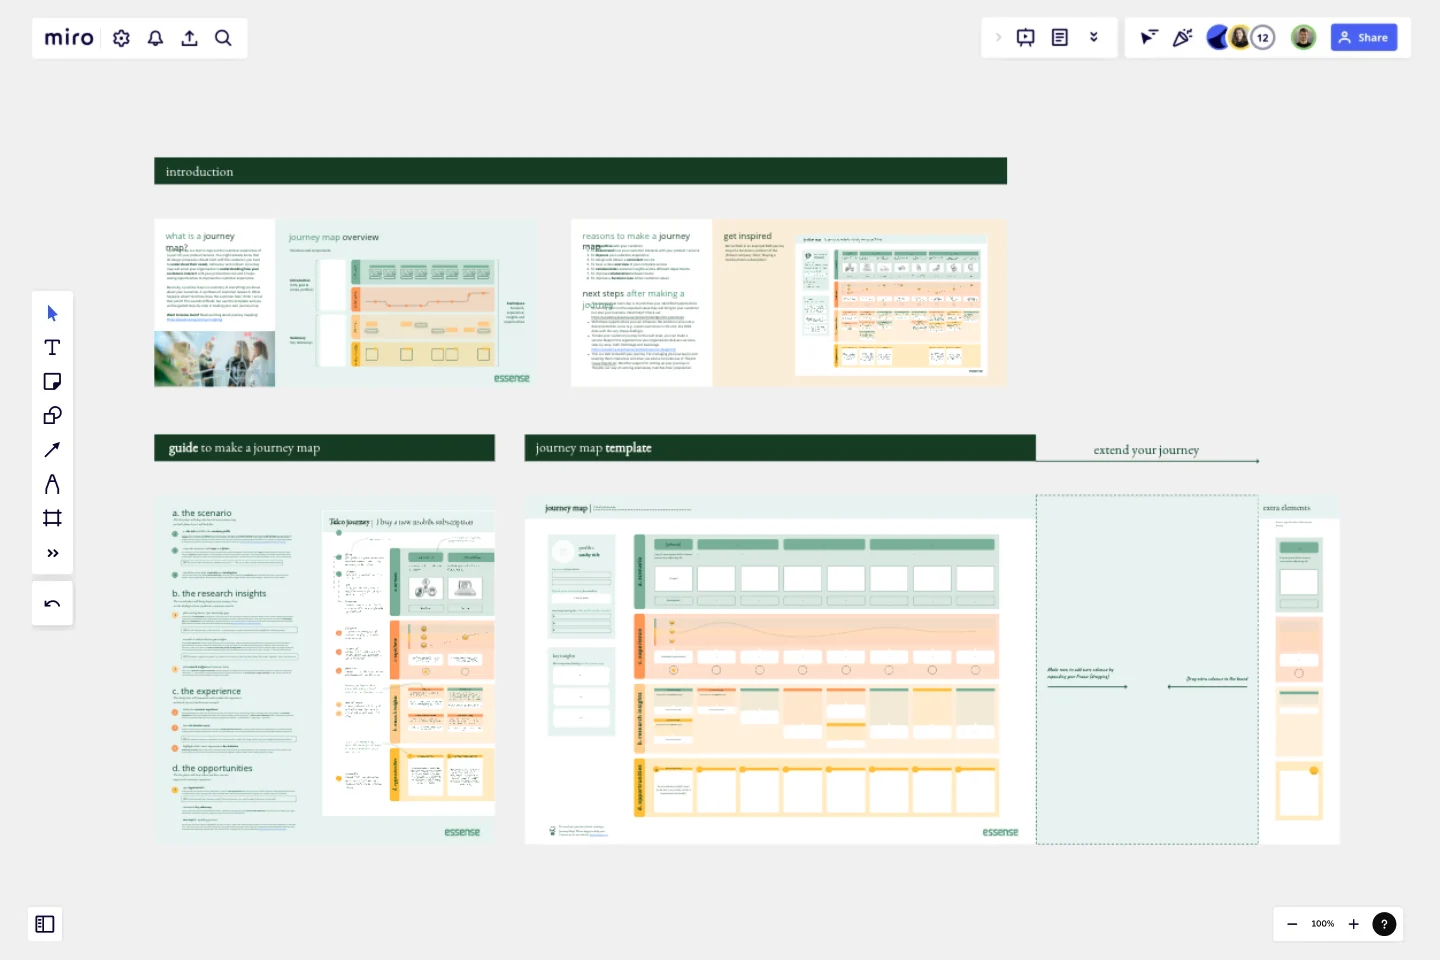
Journey Map To Plot the Customer Experience
A journey is a tool to map out the customer experience of (a part of) your product/service in a visual way.
Suppose your organization provides a product or service, for example, mobile phone subscriptions. On your Journey Map, you will find a customer who goes through the process of selecting and purchasing a subscription (scenario), how the customer perceives each step (experience), what you learned about the overall needs of your customers (insights), and what can still be improved (opportunities). A journey map will serve your organization in understanding how your customers interact with your product/service and it helps see opportunities to improve the customer experience.This sounds more difficult than it is, but use this template and you will be guided step-by-step in making your own journey map.From our experience as a service design agency, we also provide you with tips and examples for how you can use a Journey Map for empathizing with your customer and improving your customer experience. Additionally, a Journey Map can be used to gain a complete overview of your services and improve collaboration between your departments.Our instructions for making your own Journey Map:
The scenario: Determine the scenario and profile. With this scenario, sketch a first draft of what this journey could look like from the perspective of your customer. You can enrich the scenario by adding drawings or pictures.
The research insights: collect and plot existing data on the journey map (reviews, earlier research, and personas). Look for knowledge gaps and assumptions that need validation. Execute user research to collect additional insights about the customer experience (i.e. interviews or observations). Analyze this data and cluster corresponding findings, quotes and insights and plot these on your journey map.
The customer experience: Define the customer experience based on the research and insights collected, and draw the emotion curve. Here you emphasize where things go well and where improvement is needed. Determine which steps make or break the overall experience and where to focus first.
The opportunities: Together with key stakeholders, analyze the journey to spot opportunities that can improve your customer experience. The journey might contain a lot of information and opportunities, so summarise the key takeaways to make the journey actionable, and determine what the next steps will be.
This template was created by Essense.
Get started with this template right now.
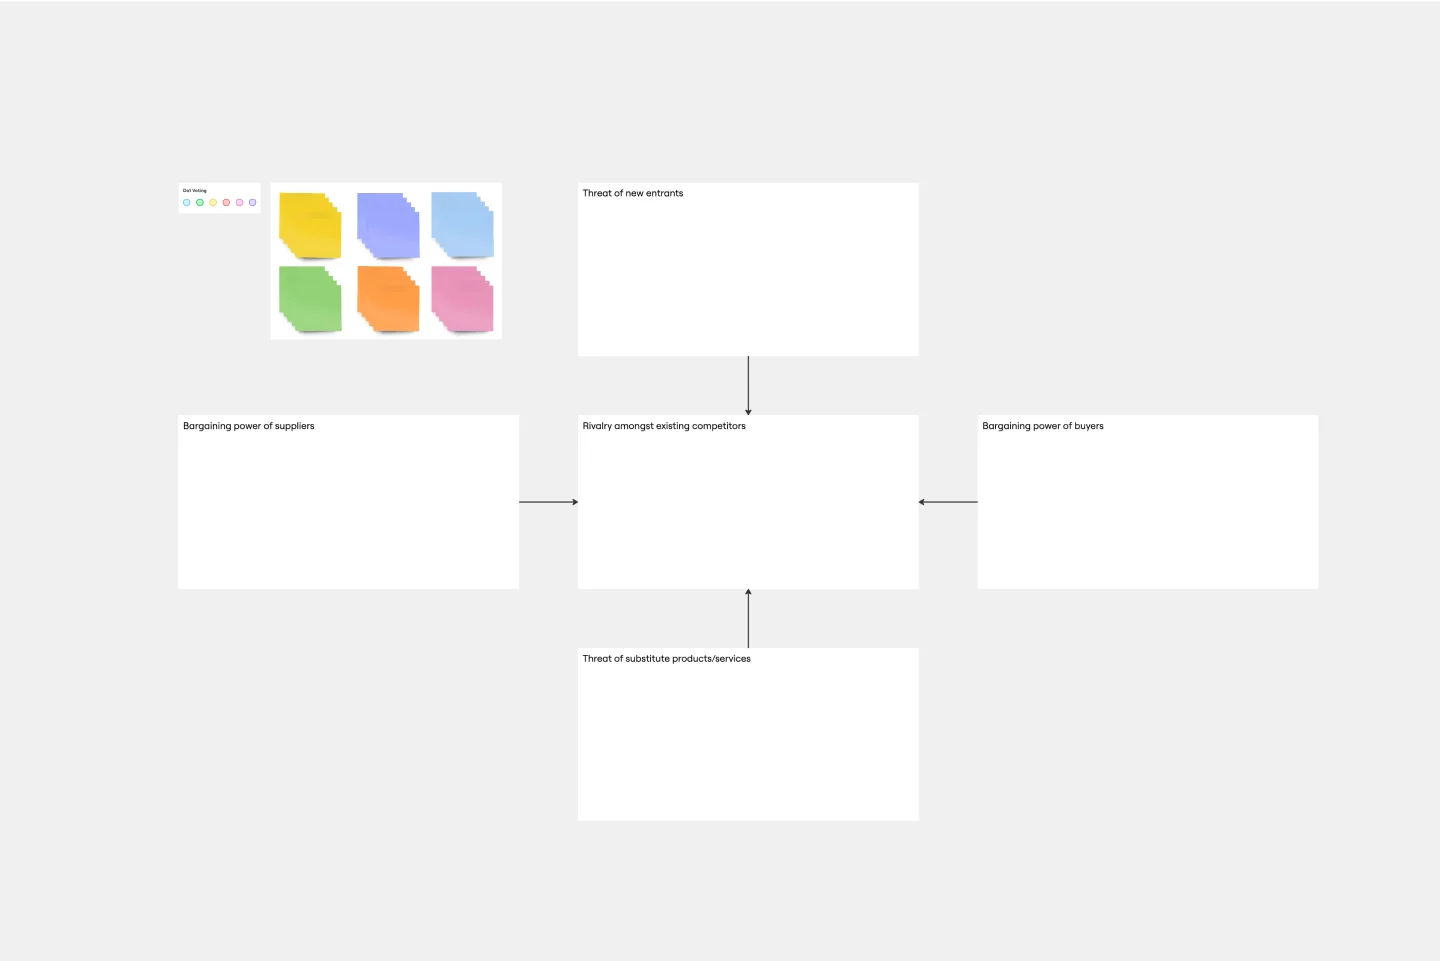
Porter's Five Forces Template
Works best for:
Leadership, Strategic Planning, Market Research
Developed by Harvard Business School professor Michael Porter, Porter’s Five Forces has become one of the most popular and highly regarded business strategy tools available for teams. Use Porter’s Five Forces to measure the strength of your current competition and decide which markets you might be able to move into. Porter’s Five Forces include: supplier power, buyer power, rivalry among existing competitors, the threat of substitute products or services, the threat of substitute products and services, and the threat of new entrants.
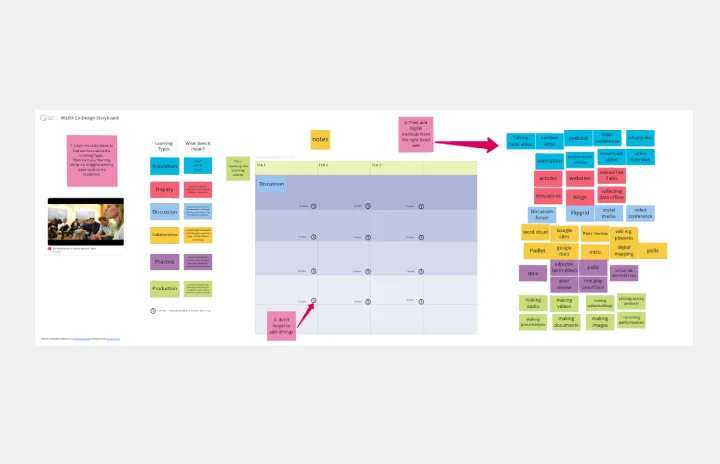
Co-design Storyboard
Works best for:
Storyboard, Planning, Design
Foster collaboration and innovation with the Co-design Storyboard template. Ideal for co-design workshops and team brainstorming sessions, this template allows multiple contributors to visualize and refine ideas together. It includes sections for user scenarios, design sketches, and feedback loops, promoting active participation and diverse input. Use this template to enhance team creativity, streamline design processes, and ensure that all voices are heard and integrated
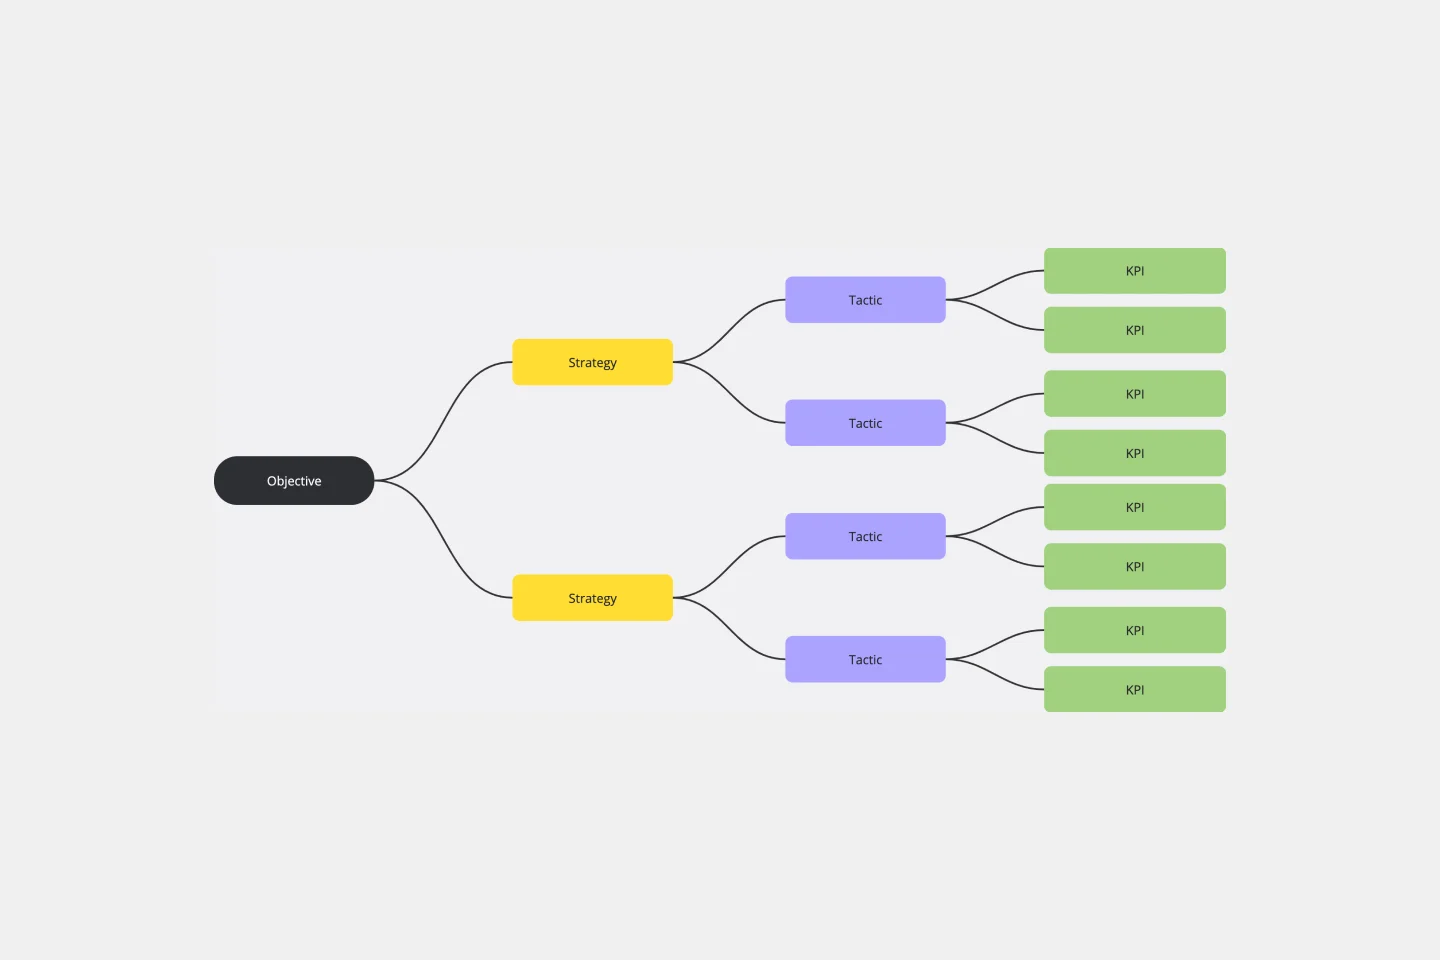
KPI Tree Template
Works best for:
Strategy & Planning
The KPI Tree Diagram is a visual tool that hierarchically illustrates an organization's objectives and breaks them down into their subsequent strategies, tactics, and measurable KPIs. By arranging these components in a tree-like structure, the diagram captures the interrelationships and dependencies between the overarching goals and the specific steps to achieve them.
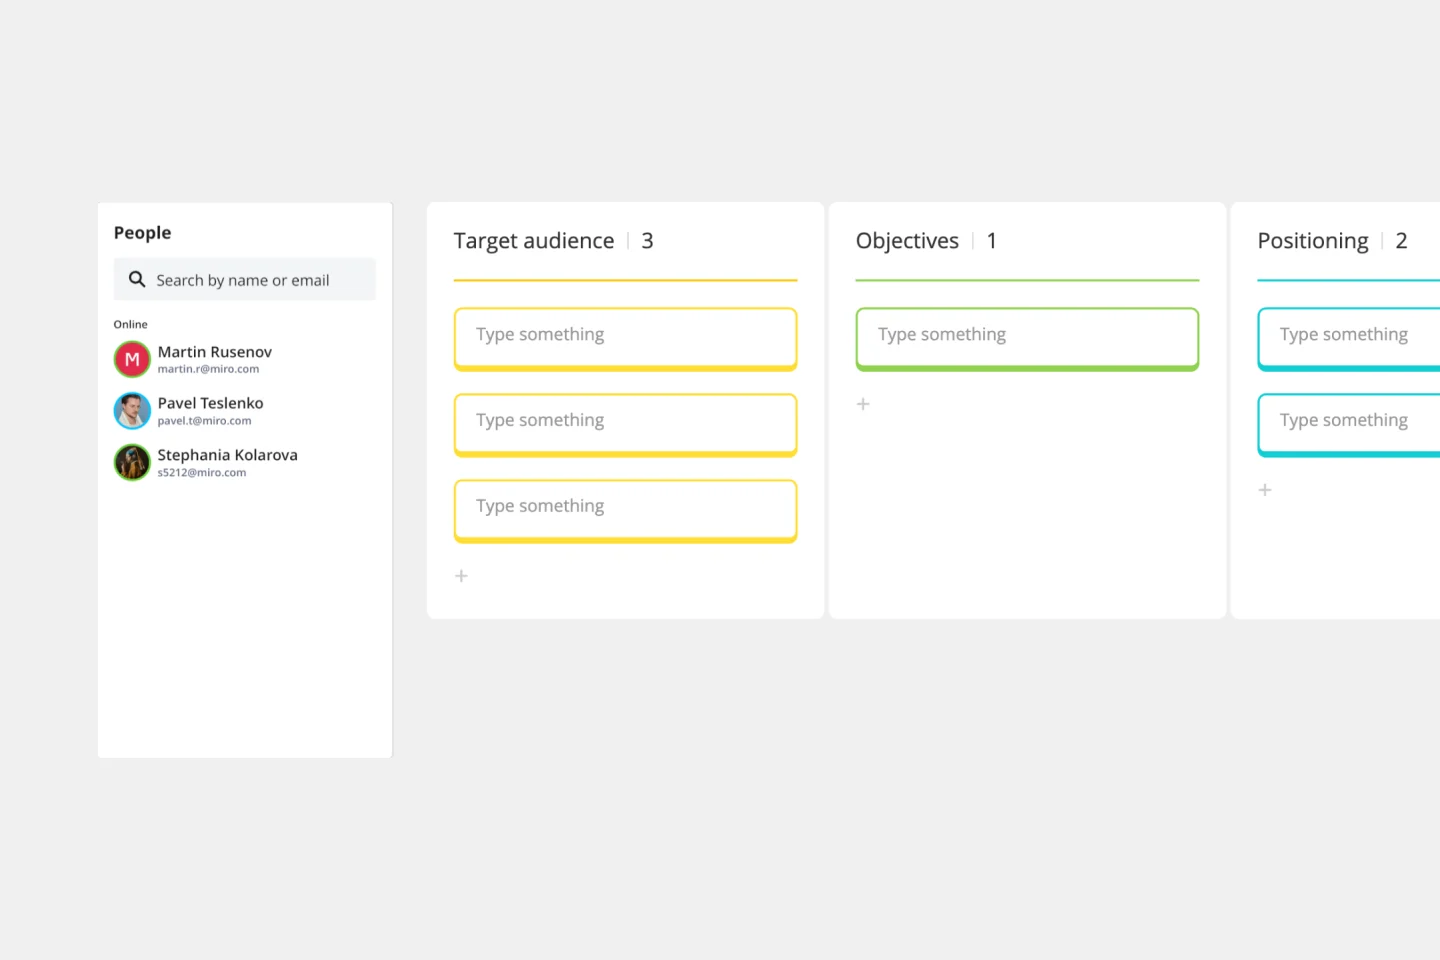
Communications Plan Template
Works best for:
Marketing, Project Management, Project Planning
You saw the opportunity. You developed the product. Now comes an important step: Find your audience and speak to them in a way that’s clear, memorable, and inspiring. You need a communications plan—a strategy for controlling your narrative at every stage of your business—and this template will help you create a good one. No need to build a new strategy every time you have something to communicate. Here, you can simplify the process, streamline your messaging, and empower you to communicate in ways that grow with your business.
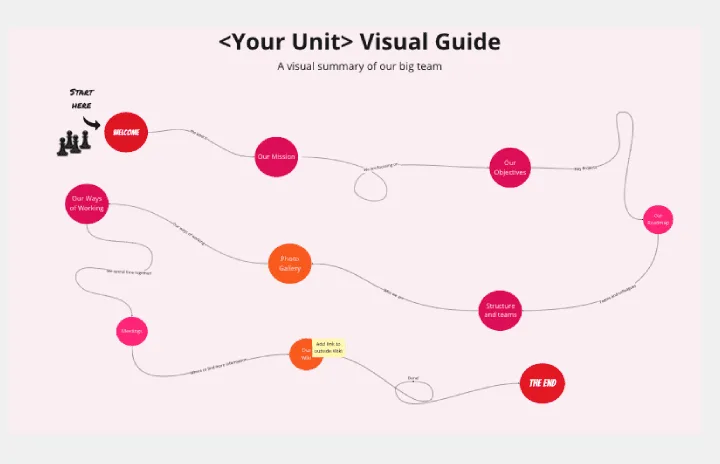
Org Unit Visual Guide
Works best for:
Org Charts, Operations, Mapping
Org Unit Visual Guide template offers a visual reference for understanding organizational units and their relationships. By mapping out departments, teams, and reporting lines, this template enhances clarity and transparency. With customizable features for adding annotations and descriptions, this template facilitates communication and alignment across organizational units.
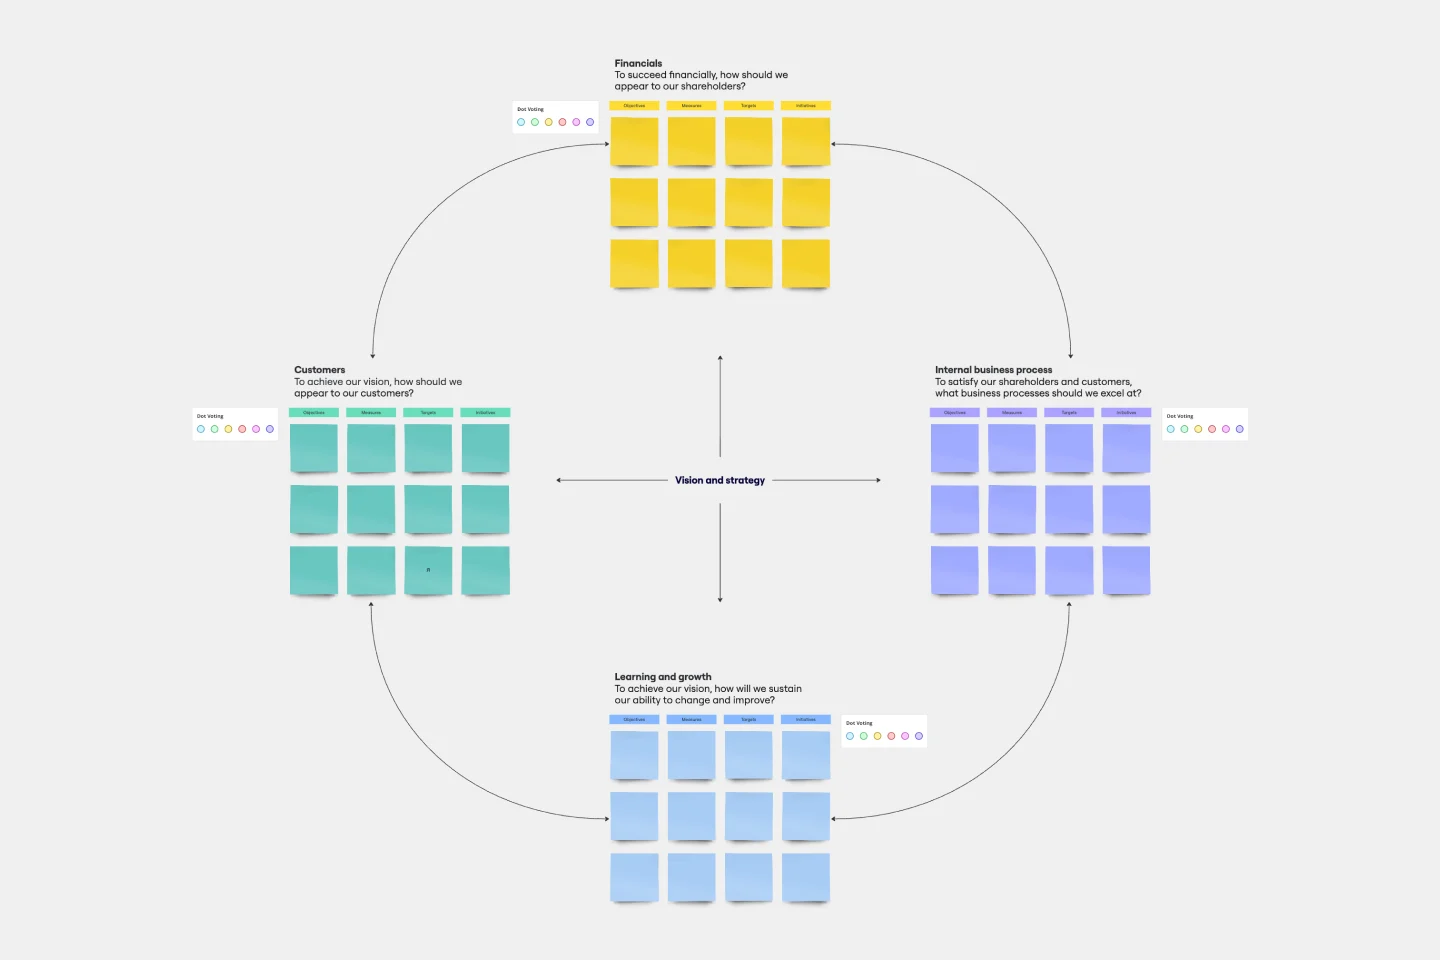
Balanced Scorecard Template
Works best for:
Operations, Strategic Planning, Project Planning
Balanced scorecards are useful tools for understanding business performance at a glance with regard to customers, employees, business processes, and financial progress. Learn more about BSCs and create your own using Miro’s Balanced Scorecard template.