Kanban Framework Template
Manage your workflow in a highly flexible and visual way with the Kanban Framework template. Optimize processes and improve your team’s efficiency.
About the Kanban Board Template
The Kanban method was created in the 1950s by Toyota Automotive employee Taiichi Ohno as a simple planning system to optimize production stages to keep up with American manufacturing (the gold standard at the time). However, it wasn’t until 2004 that David J. Anderson used the concept and applied it to IT and software. Now the Kanban framework is one of the most popular methodologies within Agile and LEAN.
What is the Kanban method?
Kanban is a popular method of LEAN workflow management valued for its real-time visualization of work capacity and full transparency of the work being done.
It consists of a timeline with tasks placed as cards, where you can see the task status, track progress, and address any bottlenecks or impediments.
When to use a Kanban board
Teams use Kanban boards to monitor the progress of work from start to finish. It’s a powerful way to display progress to yourself and cross-functional partners so that the behind-the-scenes nature of software development becomes visible. This Kanban template can be used to manage workflows and provide transparency across all stages of a project.
Benefits of using the Kanban method
Based on just-in-time manufacturing principles, Kanban helps your team reduce waste, anticipate bottlenecks and other issues, and collaborate on fixing them together.
The beauty (and power) of the Kanban method is that it’s a visual way to improve an organization's processes and can be used by anyone across any function.
Create your own Kanban board
Making your own Kanban board is easy with Miro’s ready-to-use template, the perfect canvas to create and share. Get started by selecting the Kanban template, then take the following steps to customize it according to your organization's needs.
1. Customize your Kanban board
You can label rows and columns according to your needs. David Anderson’s original method established that Kanban boards are divided into these:
visual signals
columns
work-in-progress limits
commitment point
delivery point
Some teams prefer to simplify these labels to only backlog, in progress, and done.
2. Add task cards
Start populating your Kanban board by adding Jira cards for each task or deliverable. Add tags or assign each Kanban card to an owner, and ask your team to write all backlog or in-progress projects in the appropriate column.
3. Get to work!
As steps are completed, make sure you move each card through your workflow so you can see your work pipeline from beginning to end. Be sure to check and update your Kanban board regularly so everyone can see the most up-to-date status of your tasks.
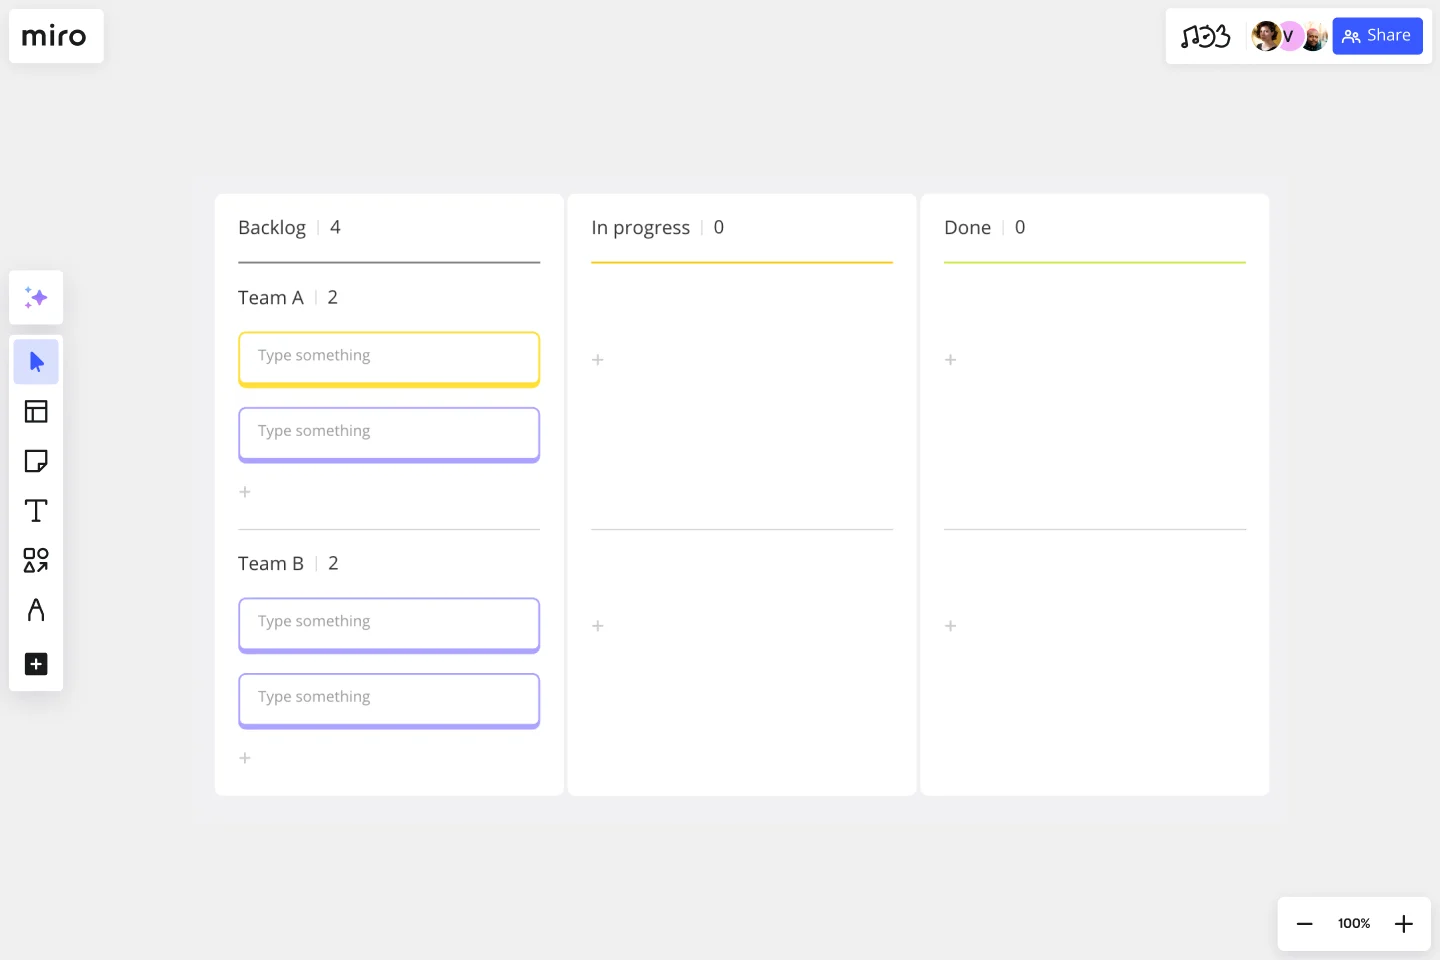
What columns should a Kanban board have?
A typical Kanban board has three columns: backlog, in progress, and done. Depending on your team’s needs, you can also add more swimlanes to have cross-functional teams collaborating all on one board.
Get started with this template right now.
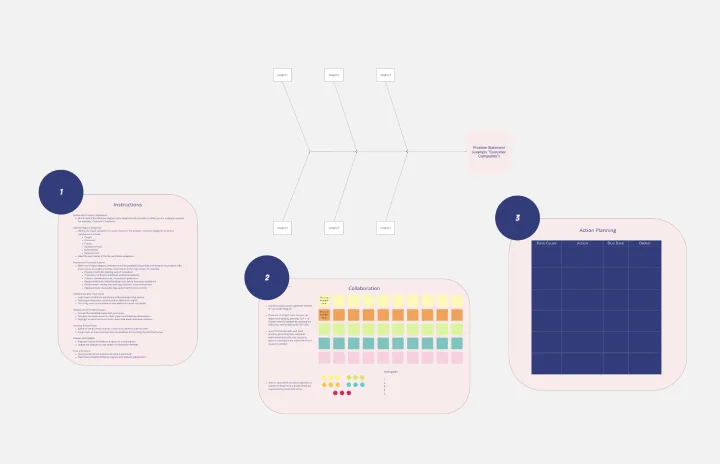
Fishbone Diagram for Service Improvement
Works best for:
Fishbone diagram
The Basic Fishbone Diagram, also known as the Ishikawa or cause-and-effect diagram, is a powerful tool for identifying the root causes of problems. Use this template to systematically explore and document potential causes of an issue, categorizing them into key areas such as people, processes, equipment, and materials. This visual approach helps teams collaborate on problem-solving, ensuring all factors are considered and addressed effectively.
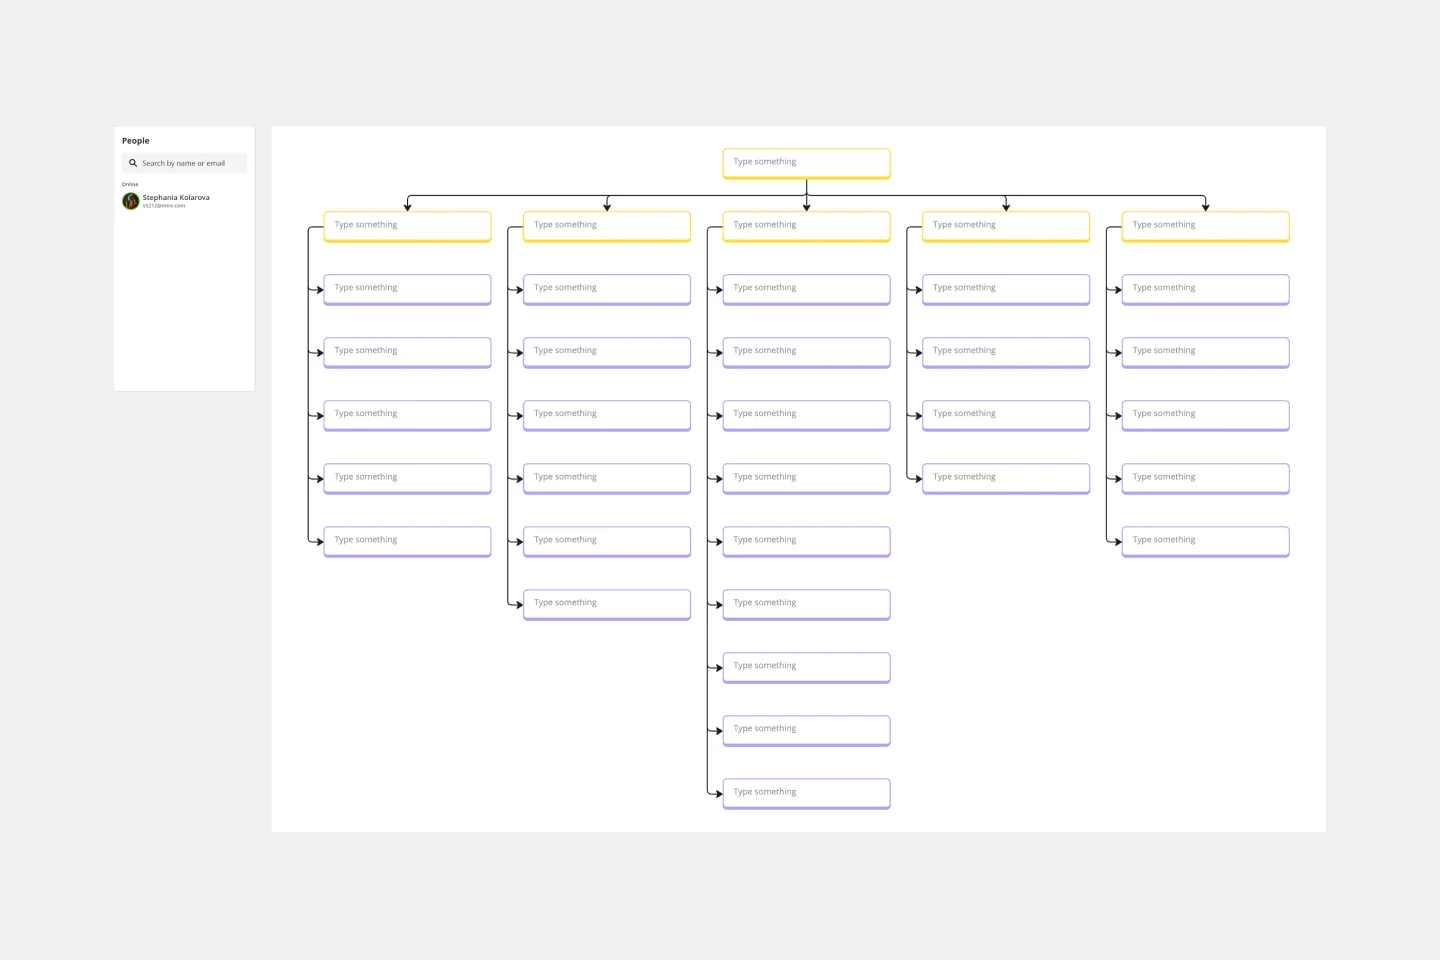
Work Breakdown Structure Template
Works best for:
Project Management, Mapping, Workflows
A work breakdown is a project management tool that lays out everything you must accomplish to complete a project. It organizes these tasks into multiple levels and displays each element graphically. Creating a work breakdown is a deliverable-based approach, meaning you’ll end up with a detailed project plan of the deliverables you must create to finish the job. Create a Work Breakdown Structure when you need to deconstruct your team's work into smaller, well-defined elements to make it more manageable.
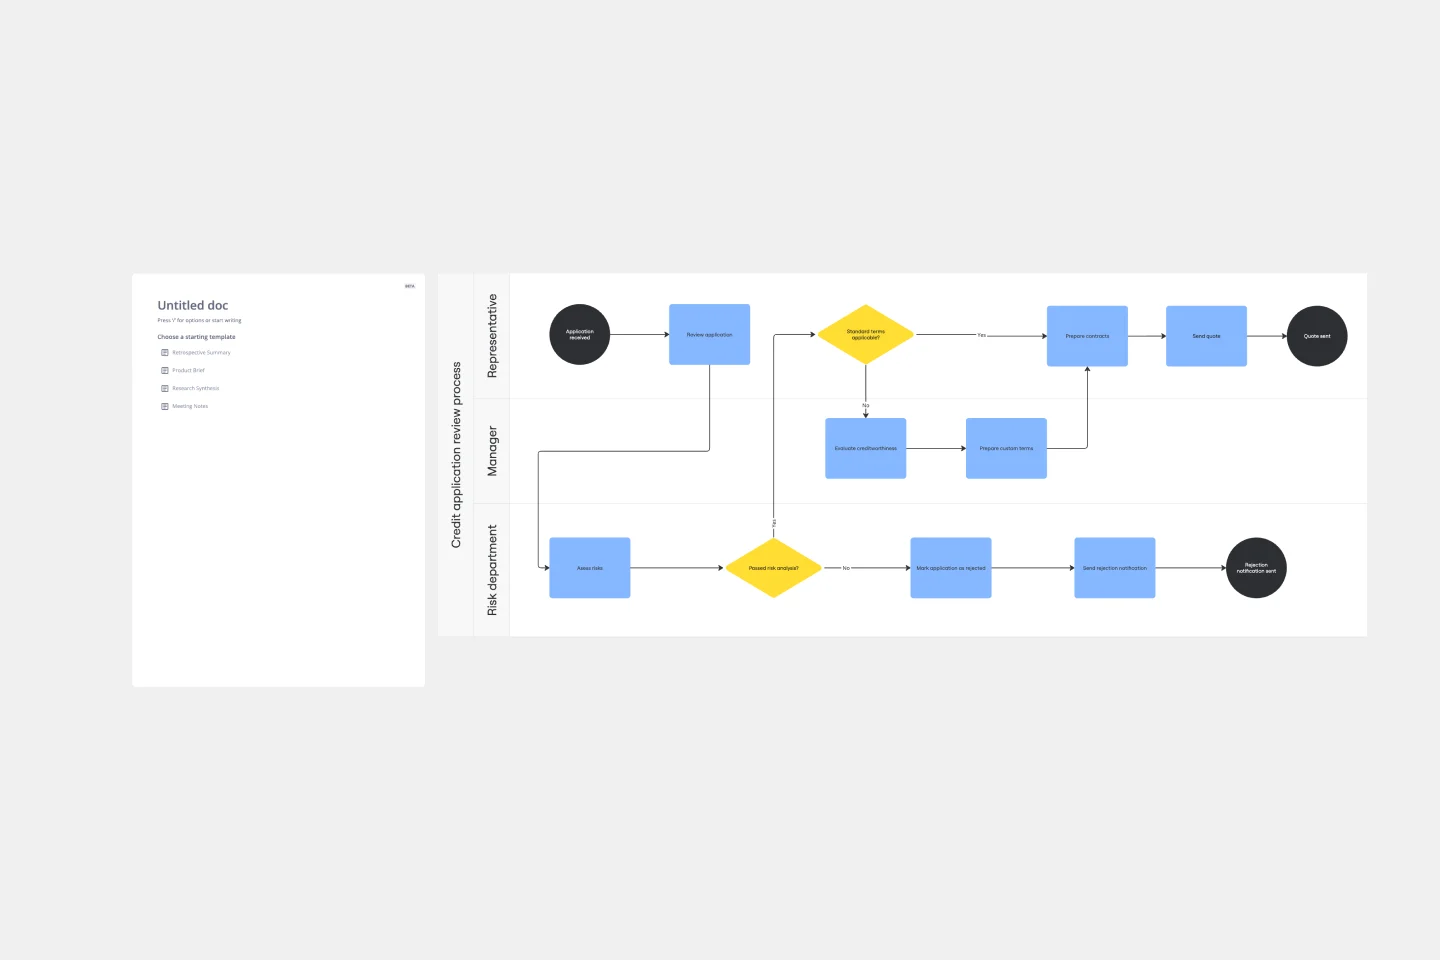
Process Map Template
Works best for:
Agile Methodology, Product Management, Mapping
Process mapping allows you to assess, document, and strategize around any plan or approach your team has put in place. It’s a useful tool for eliminating or preventing blockers. Organized by stages, a process map enables your team to divide up a process or system and record deliverables and action items at each stage of the process. By breaking down the objectives, activities and deliverables at any stage of a project, you can gain insight into whether you are on track or effectively working through a problem.
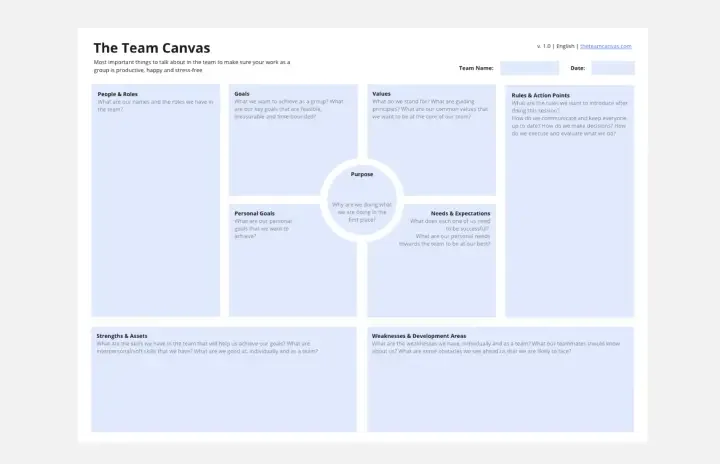
The Team Canvas
Works best for:
Agile
The Team Canvas is a versatile tool for aligning on goals, roles, and processes. It provides a structured framework for defining purpose, clarifying responsibilities, and visualizing the working environment. By fostering open communication and shared understanding, this template facilitates collaboration and increases team cohesion, empowering you to create a shared vision and drive collective success.
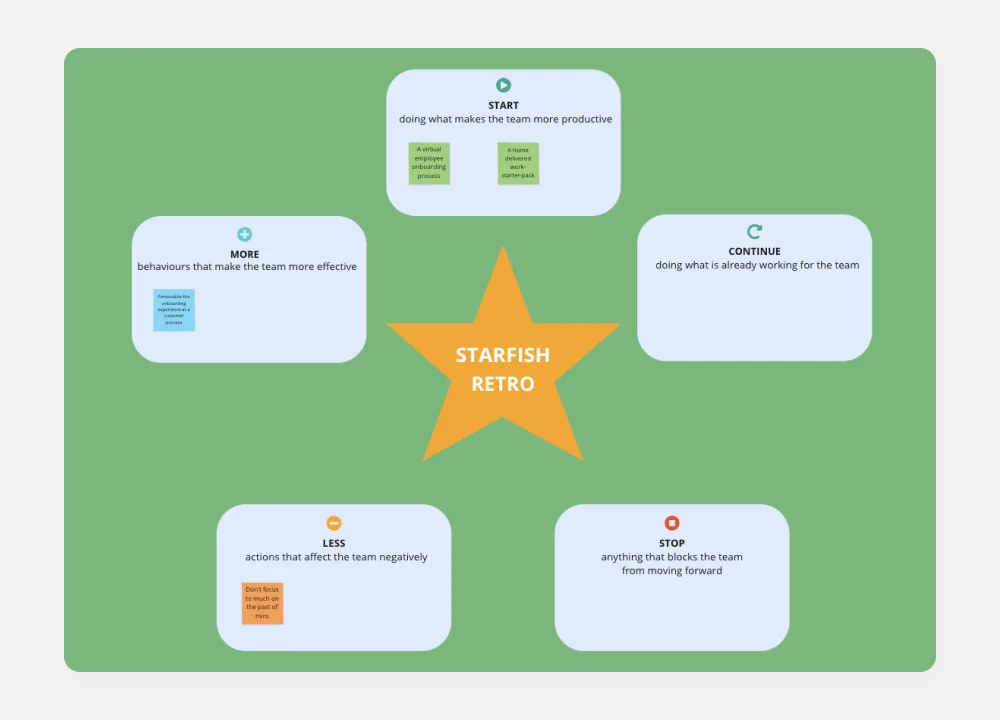
Starfish Retrospective
Works best for:
Retrospectives, Agile Methodology, Meetings
The Starfish Retrospective template offers a structured approach to retrospectives using the metaphor of a starfish. It provides elements for identifying what to start, stop, continue, do more of, and do less of. This template enables teams to reflect on past iterations, identify actionable insights, and prioritize improvements. By promoting clarity and focus, the Starfish Retrospective empowers teams to drive meaningful change and continuous improvement effectively.
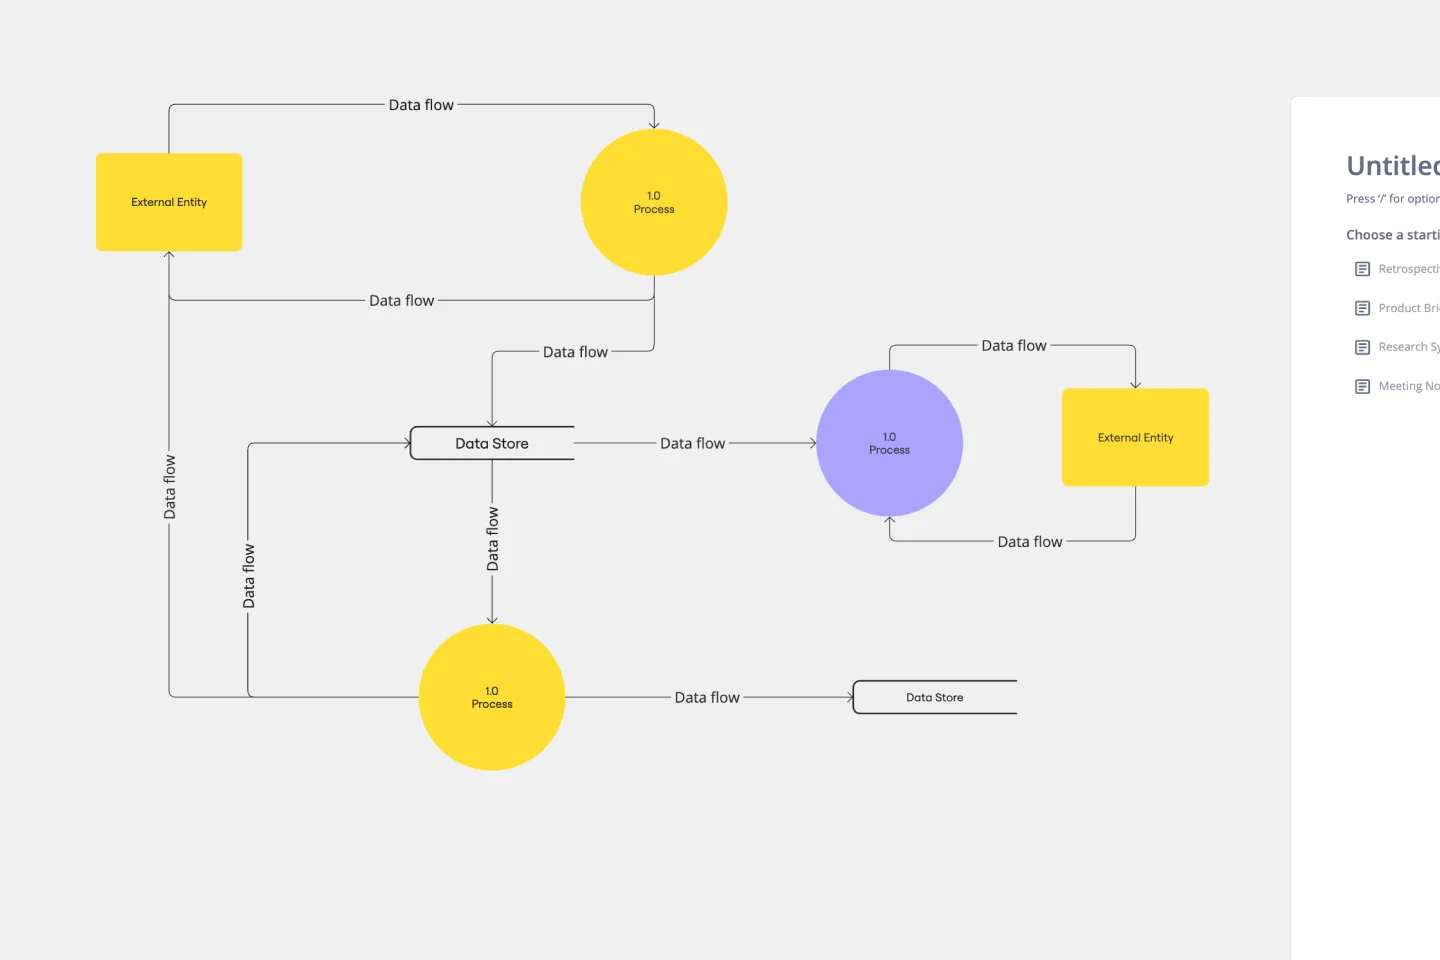
Data Flow Diagram Template
Works best for:
Flowcharts, Software Development, Diagrams
Any process can get pretty complex, especially when it has multiple components. Get a better grasp of your process through a data flow diagram (DFD). DFDs create a simple visual representation of all components in the flow of data and requirements in an entire system. They’re most often used by growth teams, data analysts, and product teams, and they’re created with one of three levels of complexity—0, 1, or 2. This template will help you easily build the best DFD for your process.