Pedigree Diagram Template
Map genetic traits to family members with a pedigree diagram.
About the Pedigree Diagram Template
You can identify how traits and diseases are passed from one generation to the next using the pedigree diagram template. Pedigree Diagrams are useful for doctors, veterinarians, farmers, and anyone else working with genes or interested in genetics.
What is a pedigree diagram?
A pedigree diagram is an advanced version of a family tree, that is commonly used to diagram relationships within family members. It shows how genetic traits and diseases are passed from one generation to the next.
You can use a pedigree diagram to see which family members carry a certain trait, like a widow’s peak. Doctors use them to see how diseases are passed from parents to children. Farmers use it in husbandry to track traits in crops and animals.
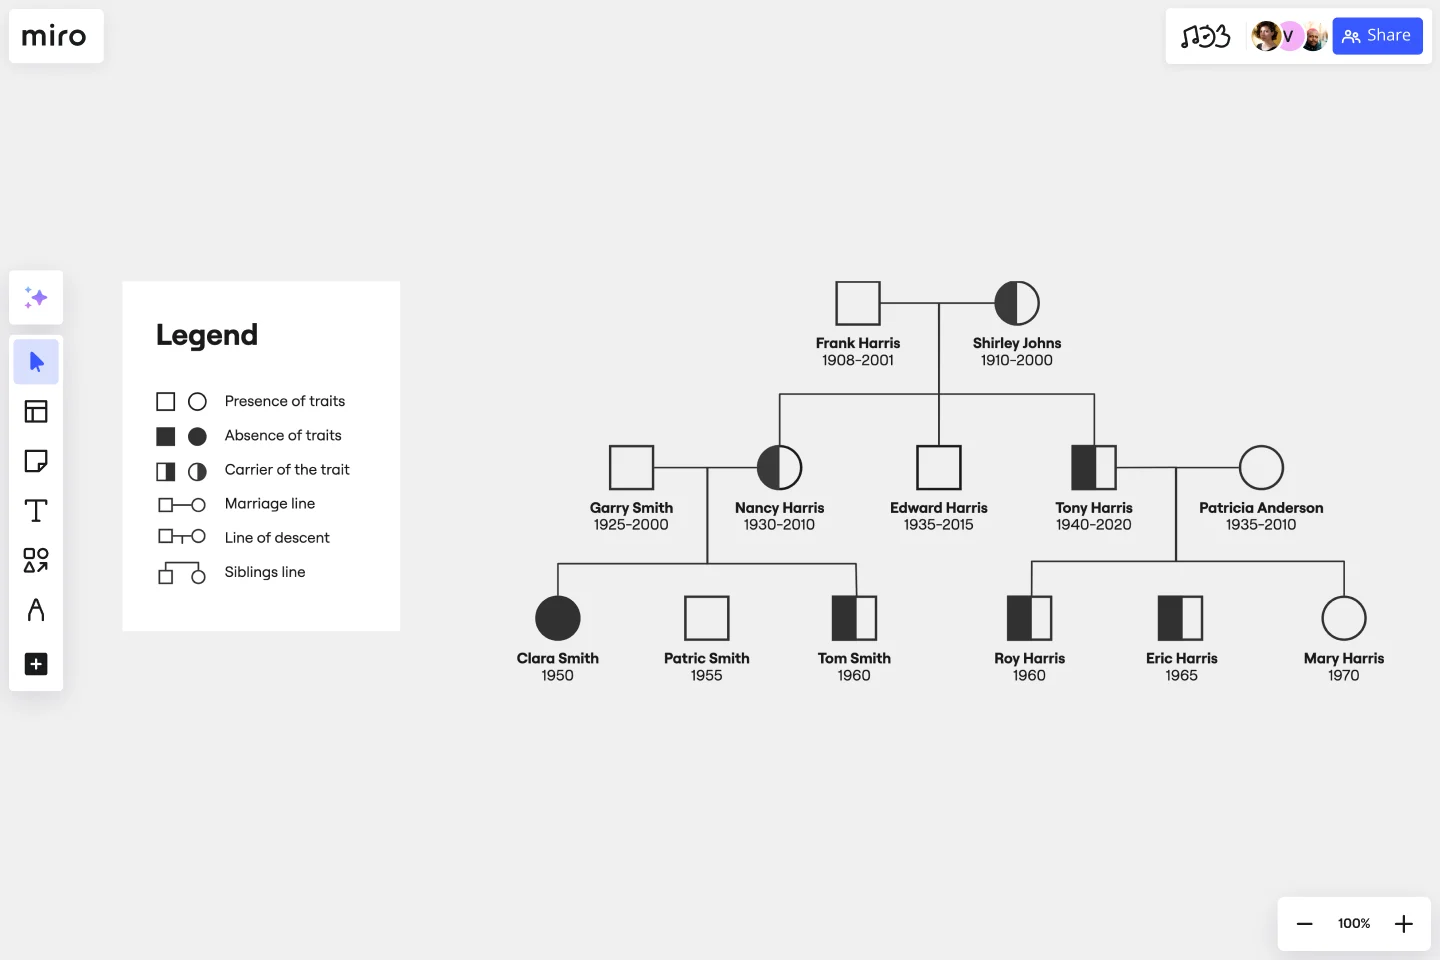
In a pedigree diagram, males are represented by squares; females by circles. Shaded symbols mean someone has a specific trait (e.g., dimples). Unshaded symbols mean an individual doesn’t have a specific trait.
Benefits of pedigree diagrams
Pedigree diagrams can help doctors identify and diagnose diseases.
For example, let’s say someone has a family history of heart disease. A pedigree diagram will tell us whether this individual is likely to have a heart condition. This can help doctors diagnose and treat patients faster, then provide better healthcare.
In science, pedigree diagrams can help understand how traits are inherited.
For example, dimples may pass from father to son in one family, and from mother to daughter in another. Blonde hair might pass from grandparents to grandchildren, but not from parents to children. Pedigree diagrams make patterns like these easy to identify.
Create your own pedigree diagram
Miro’s is the perfect starting point for a pedigree diagram. Get started by opening the template on this page and following the steps below.
Step 1:
Add individuals to your pedigree diagram. Go with as many as you can — or as many as are relevant. Place older generations at the top and younger ones below them.
Males are represented by squares. Females are represented by circles.
You can always use Miro to change symbols around later, so if you make a mistake, don’t worry. Just try to be as thorough as possible.
Step 2:
Connect individuals using lines of marriage and descent. A straight horizontal line represents the marriage between two individuals.
Descent is represented by diagonal and vertical lines that connect a couple from an older generation to a younger individual.
Step 3:
Add dates. This isn’t strictly necessary, but it can help keep track of individuals across generations.
Add dates of birth, death, and/or marriage lines to your pedigree diagram template.
Step 4:
Use symbols to show which family members have or don’t have a specific trait.
For example, let’s say your pedigree diagram shows widow’s peaks. Family members who don’t have a widow’s peak will be represented by unshaded symbols. Family members who do have a widow’s peak will be represented by a shaded symbol.
Once you’re ready to collaborate and receive feedback, use Miro to share your Pedigree diagrams. You may want to also create a family tree to share other details of your family.
Example of pedigree diagram
Let’s imagine the Smith family has a long history of diabetes. But, some members of the family develop the condition, while others don’t.
We can use a pedigree diagram to see the pattern of inheritance, i.e., how the disease is passed from parent to child.
This can help us predict whether a given Smith family member has diabetes or will develop it in the future.
How do you draw a Pedigree Diagram?
Open our Pedigree Diagram template. Map out a family tree using lines to show familial relationships. Once you’re done, identify individual genetic traits using Pedigree Diagram shapes and shading.
What do the symbols in a Pedigree Diagram mean?
A square represents a male; a circle indicates a female. Shaded shapes mean someone has a genetic trait. Unshaded shapes mean an individual doesn’t have a trait. A half-shaded shape means that someone carries a genetic trait without it being visible.
What is the purpose of a Pedigree Diagram?
A Pedigree Diagram is a family tree that shows how genes are passed from generation to generation. It can help us predict the likelihood of a child having a disease or trait, e.g., dimples or diabetes. It can also help us see how traits are passed from parents to children.
Is a circle male or female in Pedigree Diagrams?
In Pedigree Diagrams, a circle is always female. This is universal for all organisms, including trees and flowers. Males are represented by squares.
What do dark circles mean on a Pedigree Diagram?
A dark circle represents a female that has a visible genetic trait. For example, a woman who has her father’s blonde hair or her mother’s dimples might be represented by a dark circle.
Get started with this template right now.
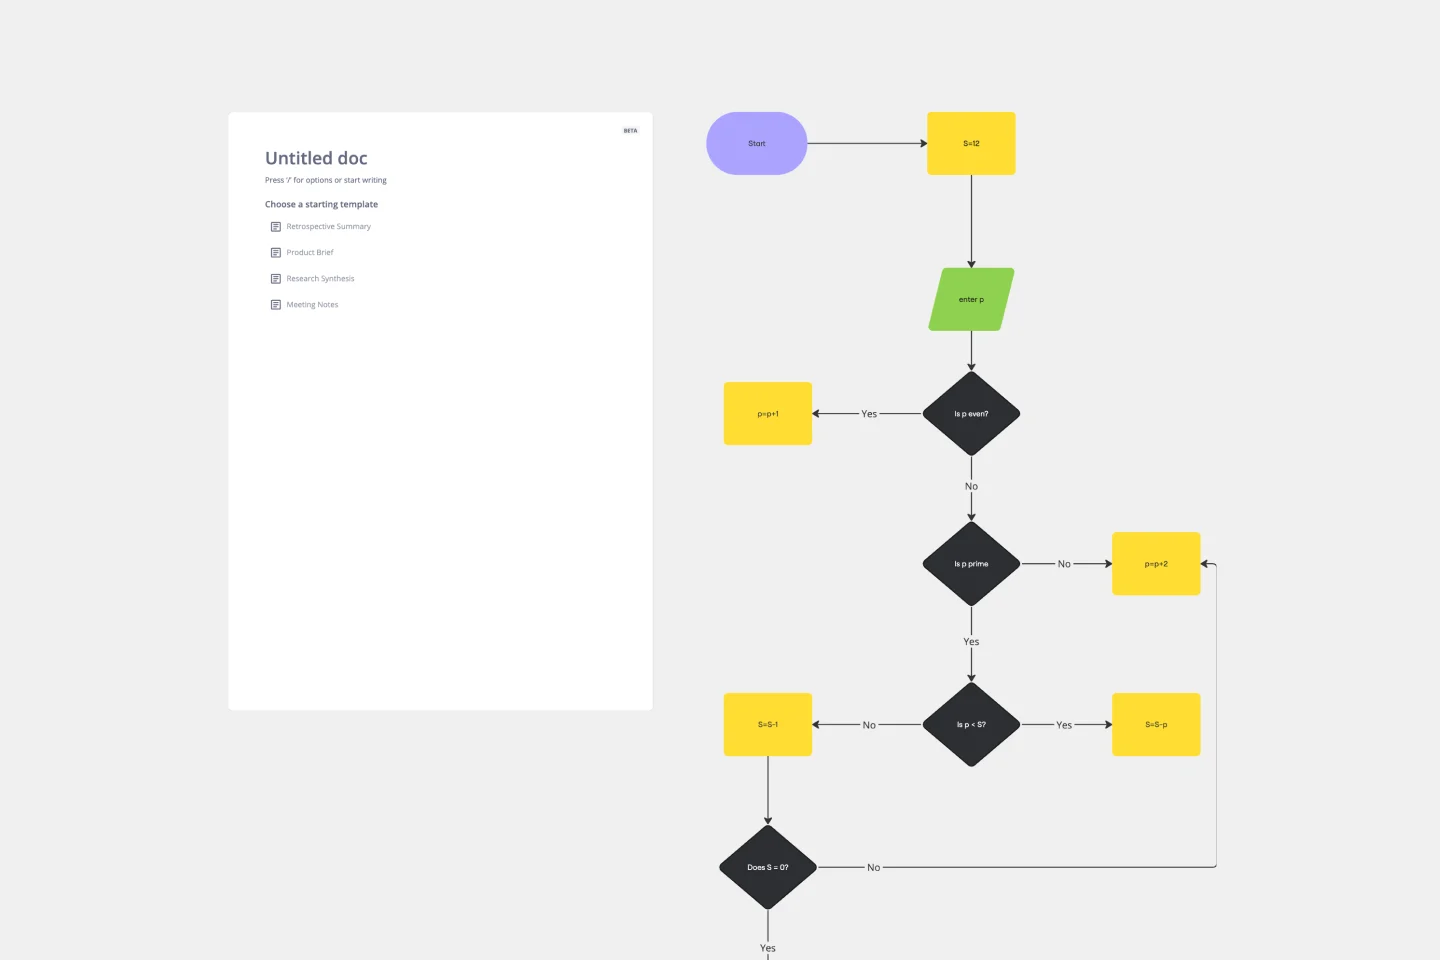
Algorithm Flowchart Template
Works best for:
Flowcharts
The Algorithm Flowchart Template is a useful tool for simplifying the process of creating and understanding complex algorithms. Its pre-structured format makes it easy to lay out each operation and decision point in a clear and easily understandable visual format. This is particularly helpful for explaining intricate processes to team members who may not be as technically proficient in the subject matter. With each step clearly defined within its designated shape, the flowchart promotes clarity and makes it easy to identify the logical flow at a glance. This clarity is the template's most significant advantage, reducing cognitive load and enabling a more inclusive and straightforward approach to discussing and refining algorithmic solutions.
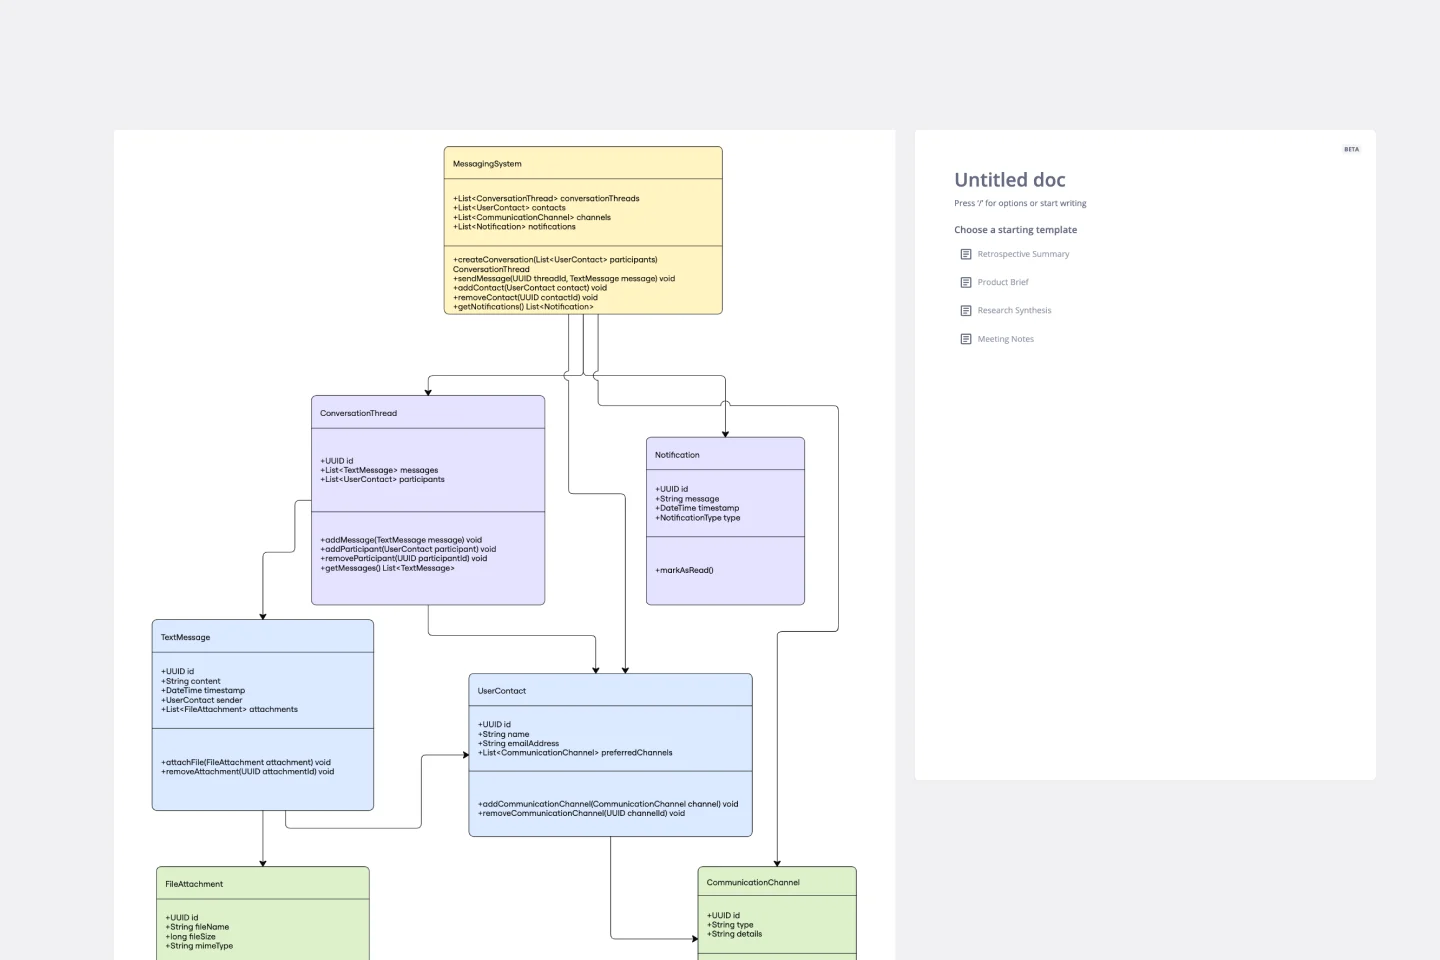
UML Class Messaging System Template
Works best for:
UML
The UML Class Messaging System Template streamlines the process of designing and analyzing messaging systems. It allows users to visually map out the structure of a system by detailing classes, their attributes, operations, and the relationships among objects. This template is particularly useful for illustrating the functionality of a messaging system, including the management of text messages, conversation threads, user contacts, notifications, and channels. It offers a clear visual representation of how all these elements interact within the system, making it an invaluable resource for developers, designers, and stakeholders aiming to enhance communication and reduce errors in the development phase.
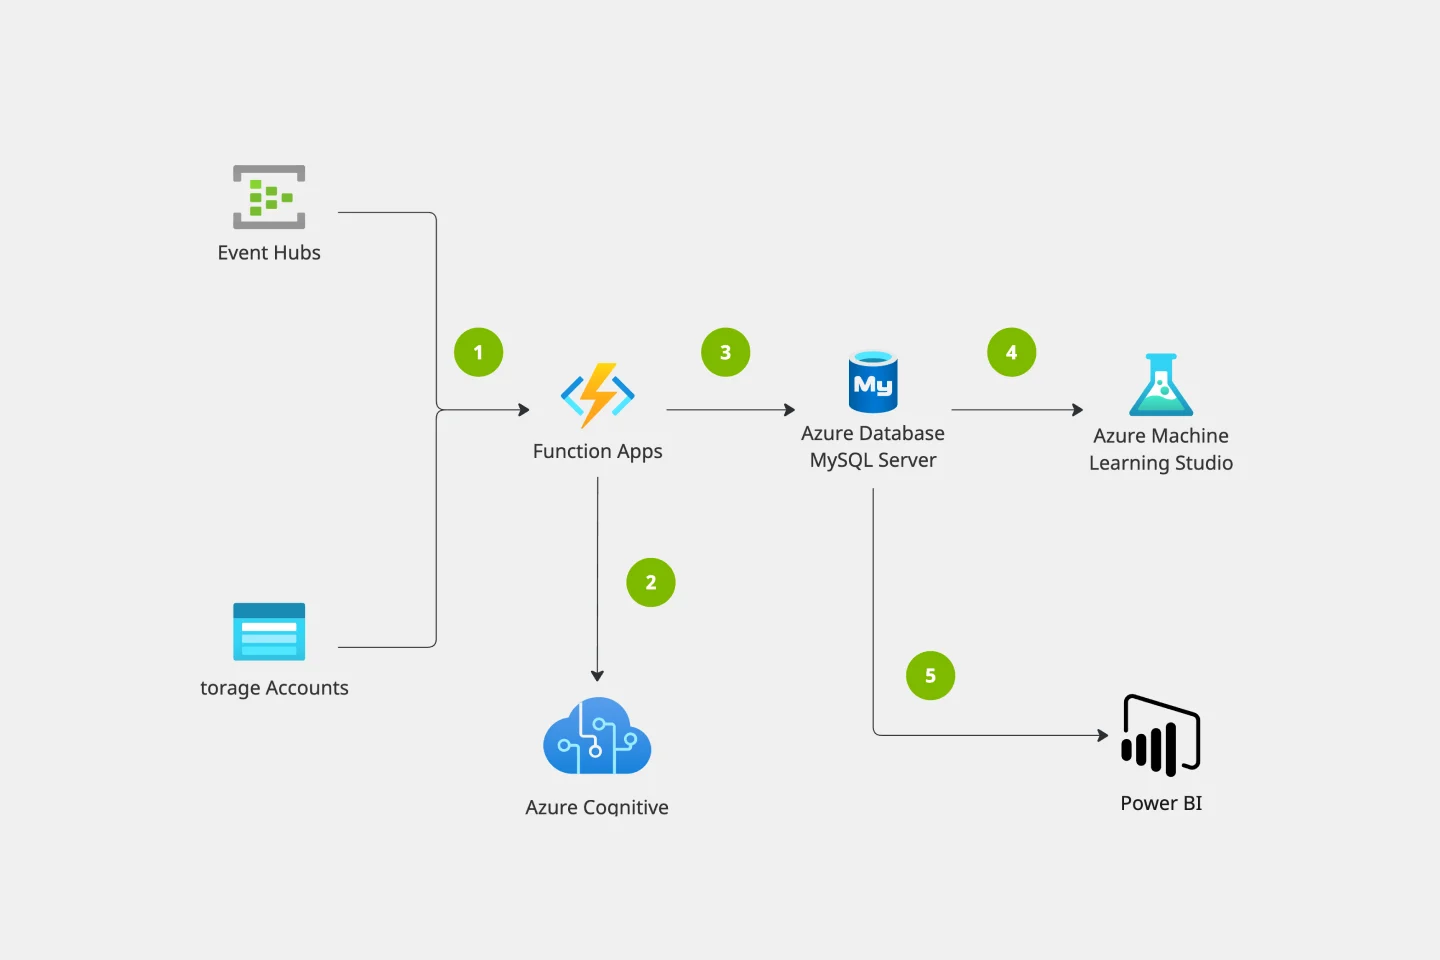
Azure Architecture Diagram Template
Works best for:
Software Development, Diagrams
The Azure Architecture Diagram Template is a diagram that will help you visualize the combination of any data and build and deploy custom machine learning models at scale. Azure is Microsoft’s cloud computing platform, designed to provide cloud-based services such as remote storage, database hosting, and centralized account management. Use Azure Architecture Diagram template to build sophisticated, transformational apps.
Website Flowchart Template
Works best for:
Flowcharts, Mapping, User Experience
A website flowchart, also known as a sitemap, maps out the structure and complexity of any current or future website. The flowchart can also help your team identify knowledge gaps for future content. When you’re building a website, you want to ensure that each piece of content gives users accurate research results based on keywords associated with your web content. Product, UX, and content teams can use flowcharts or sitemaps to understand everything contained in a website, and plan to add or restructure content to improve a website’s user experience.
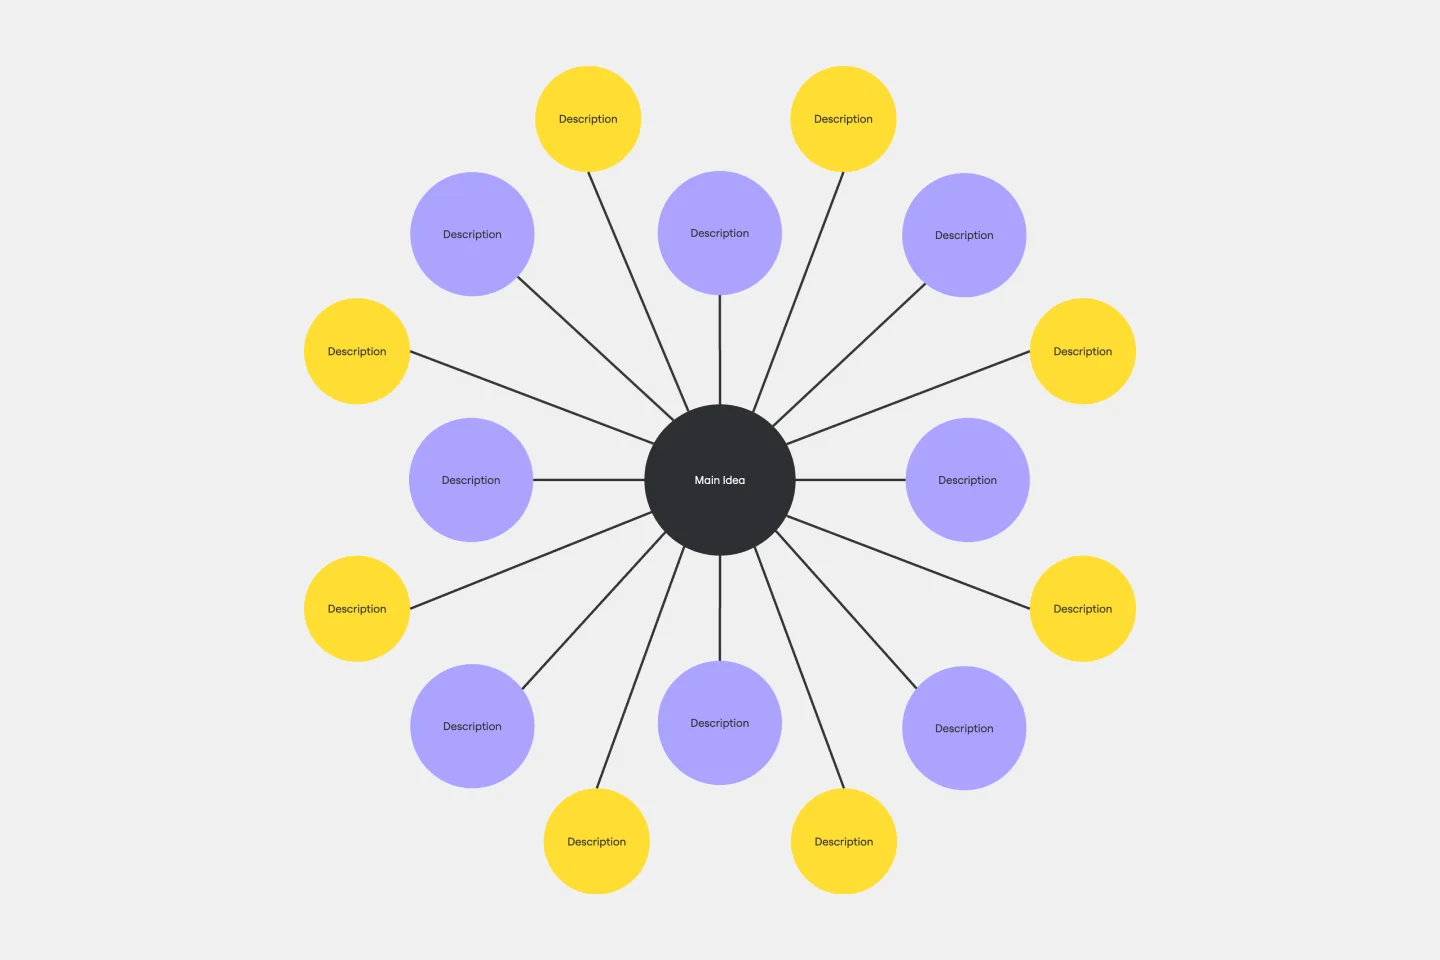
Bubble Map Template
Works best for:
Diagramming, Mapping, Brainstorming
A Bubble Map Template is a visual organization tool that uses bubbles or circles to represent various ideas or data points. These bubbles are linked together, displaying their relationships and creating a network of interconnected thoughts. Use a Bubble Map Template to streamline complex information, enhancing comprehension and promoting efficient decision-making.

Miro x AWS: Accelerate your cloud journey
Works best for:
Diagramming
The Miro x AWS: Accelerate your cloud journey template offers a visual framework for planning and executing cloud migration and optimization projects using Amazon Web Services (AWS). It provides elements for mapping out cloud architectures, migration strategies, and cost optimization initiatives. This template enables teams to collaborate effectively, align on objectives, and accelerate their cloud journey with AWS services. By promoting collaboration and alignment, the Miro x AWS template empowers organizations to leverage AWS cloud technologies efficiently and achieve their business objectives effectively.