PERT Chart Template
Track project timelines, tasks, and dependencies at a single glance using a PERT chart template.
About the PERT Chart Template
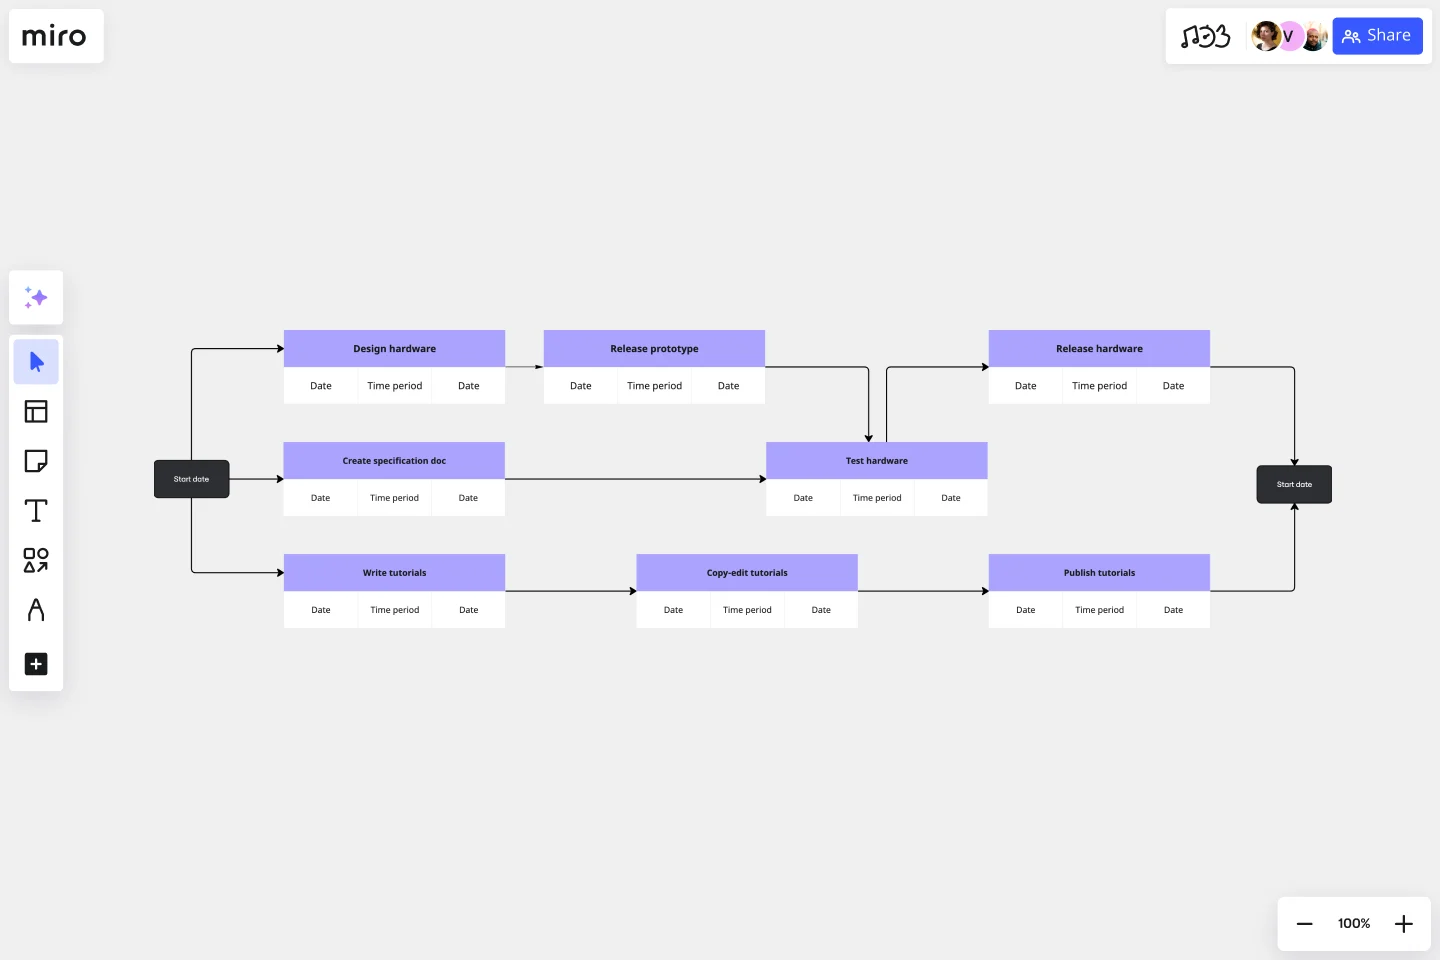
Miro’s PERT chart template is a project management tool that allows you to create a visual roadmap for your project. Designed to let you see interdependencies and to help you identify possible bottlenecks, this template consists of nodes and vectors that are easy to fill out and customize.
We’ll walk you through how to make the most of the PERT chart template.
How to use the PERT chart template
To get started, click on the blue “use template” button to open the PERT chart template in Miro. Once you’re in, follow the steps below to start filling it out.
1. Identify project tasks
Break your project down into tasks. Then, label the blue headers along the nodes with the task names. Double-click on the pre-written text to replace it with your own. Below the blue headers, add each task's expected start and end dates and the estimated durations by double-clicking on the text boxes.
2. List task dependencies
Are there any tasks you can’t start until another one’s been completed first? That means you have dependencies. Use the arrows in the PERT chart template to connect dependent tasks, and make sure the direction represents the order you need to complete them.
4. Label dependencies
Add more detail to clarify the nature of each dependency by labeling the arrows with one of the following:
Finish-to-Start (FS): You can’t start a task until you’ve completed the preceding task.
Start-to-Start (SS): You can start a task as soon as you’ve started its preceding task.
Finish-to-Finish (FF): You can’t finish a task until you’ve completed the preceding task.
Start-to-Finish (SF): You can’t finish a task until you’ve started the preceding task.
Grab text boxes from the toolbar and place them along the arrows to add your labels.
6. Identify a critical path
Use the estimated durations to calculate the critical path. Then, use colors to outline nodes or arrows to visualize it.
7. Share your diagram
Once you’ve filled in the PERT chart template, you can share it with your team and key stakeholders for feedback and easily make changes to your Miro board anytime.
Benefits of using Miro’s PERT chart template
Miro’s PERT chart template makes it especially easy to manage projects that involve multiple team members and stakeholders. With advanced collaboration features at your fingertips, you can easily build a PERT chart together online in real-time or invite others to view and comment on your Miro board when you’re ready — making it an ideal solution for remote and hybrid teams.
The PERT chart template is also fully customizable, allowing you to take advantage of Miro’s extensive editing features — from resizing nodes and text to changing up colors and line thickness.
Is Miro’s PERT chart template free?
Yes, all our templates are free and ready to use. Simply click on the blue “Use template” button to get started.
Can I share the PERT chart template with others outside my team?
Yes, there are several ways to share the PERT chart template. Export your Miro board as a PDF or image to attach it as a file to a message. Alternatively, you can embed your Miro board on other sites or generate a shareable link to send to others.
What is the critical path in a PERT chart?
A critical path shows the longest path of essential tasks you must complete to finish a project. For example, you can't move on to do the upholstery and interior if you haven't finished putting up the walls and roof. When one of these tasks is late, it impacts the entire project. To make up for missed deadlines on critical tasks, reallocate resources and staff from the low-impact tasks.
Get started with this template right now.
UML Sequence Registration Process Template
Works best for:
UML
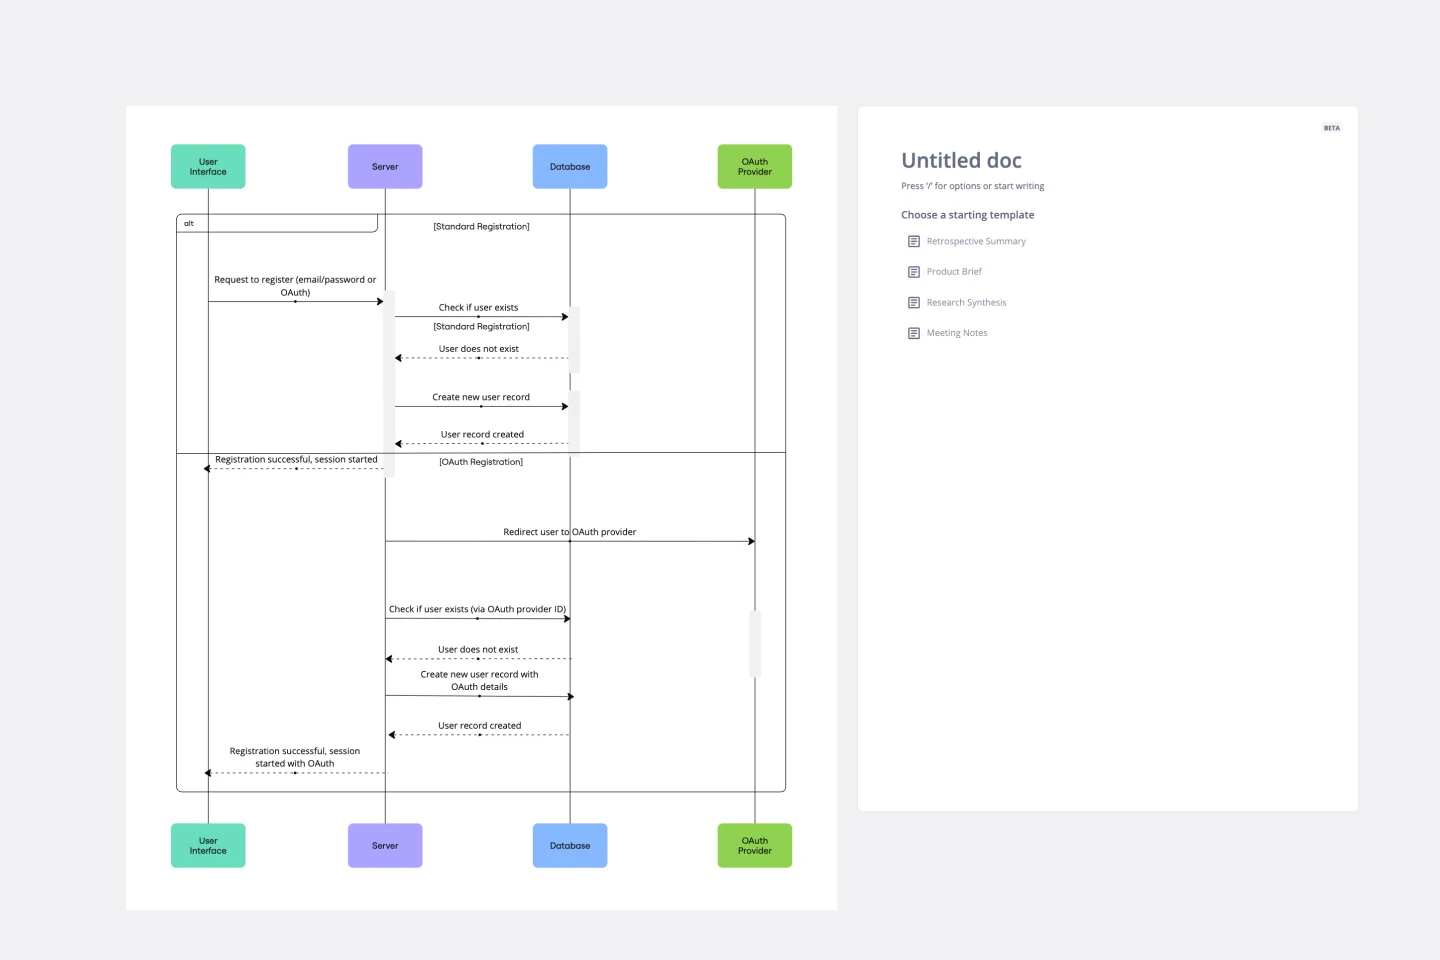
The UML Sequence Registration Process Template helps visualize and document user registration processes. It enables the rapid creation of sequence diagrams, which are crucial for enhancing clarity and identifying potential issues early in the design phase. This template not only supports collaborative efforts through Miro's platform, facilitating real-time teamwork, but also ensures a comprehensive system design. Being part of a broader collection of UML diagram templates, it stands as a valuable asset for projects involving registration workflows, contributing to streamlined project execution and effective communication among team members.
Sitemap Template
Works best for:
Mapping, Software Development, Diagrams
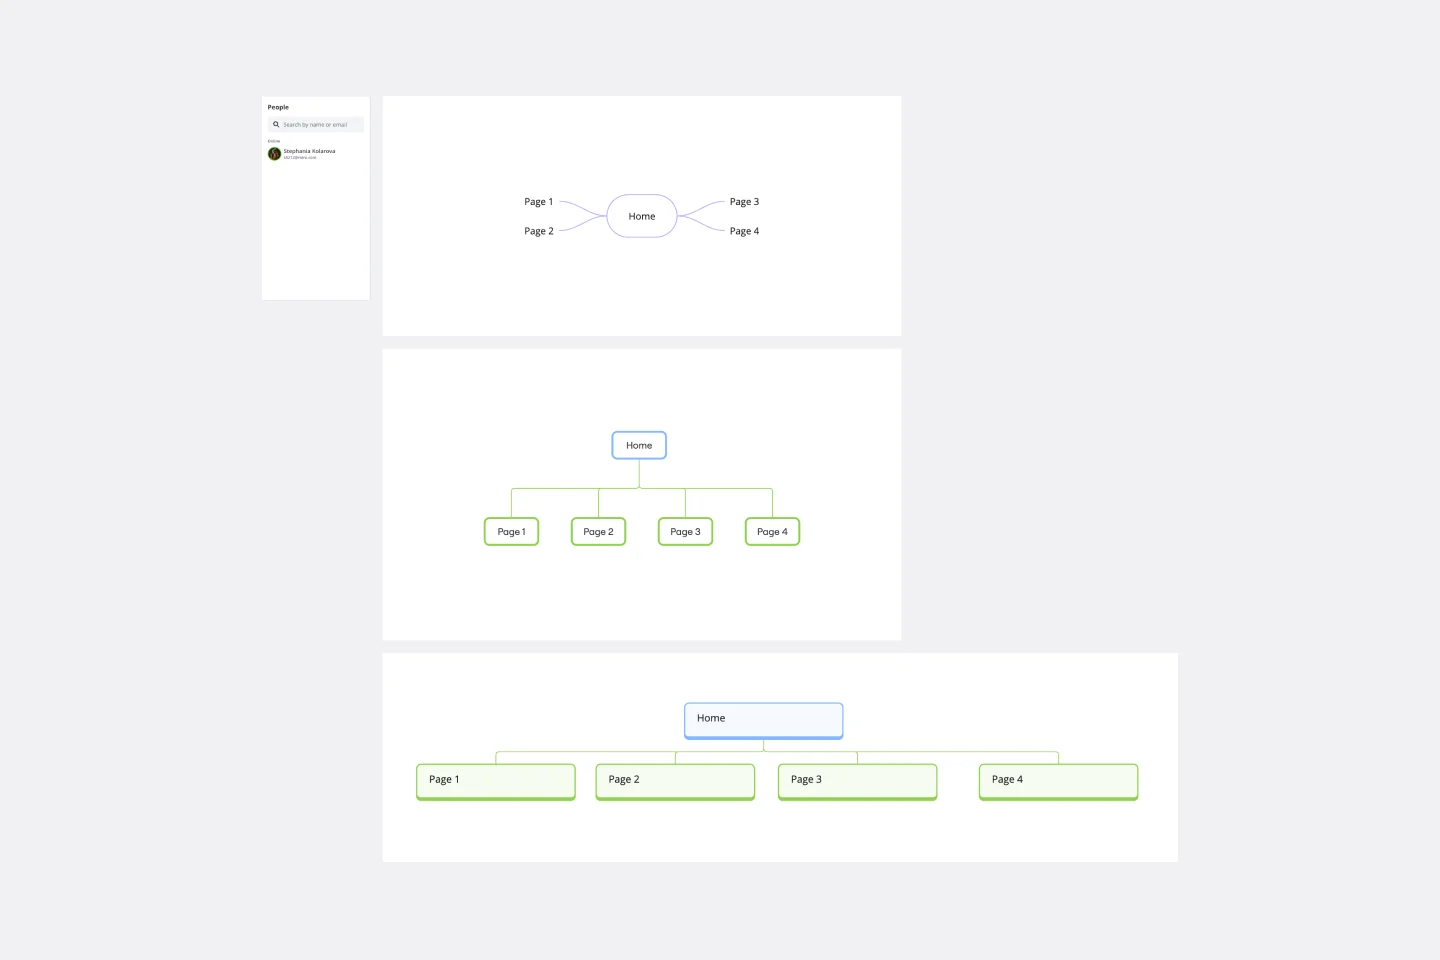
Building a website is a complex task. Numerous stakeholders come together to create pages, write content, design elements, and build a website architecture that serves a target audience. A sitemap is an effective tool for simplifying the website design process. It allows you to take stock of the content and design elements you plan to include on your site. By visualizing your site, you can structure and build each component in a way that makes sense for your audience.
Timeline Meeting
Works best for:
Timeline, Planning
The Timeline Meeting template is tailored for planning and conducting meetings with a focus on time management. It helps you set clear agendas, allocate time for each topic, and keep track of discussion points. This template ensures your meetings are productive and stay on track.
Decision Tree Template
Works best for:
Decision Making, Mind Mapping, Diagrams
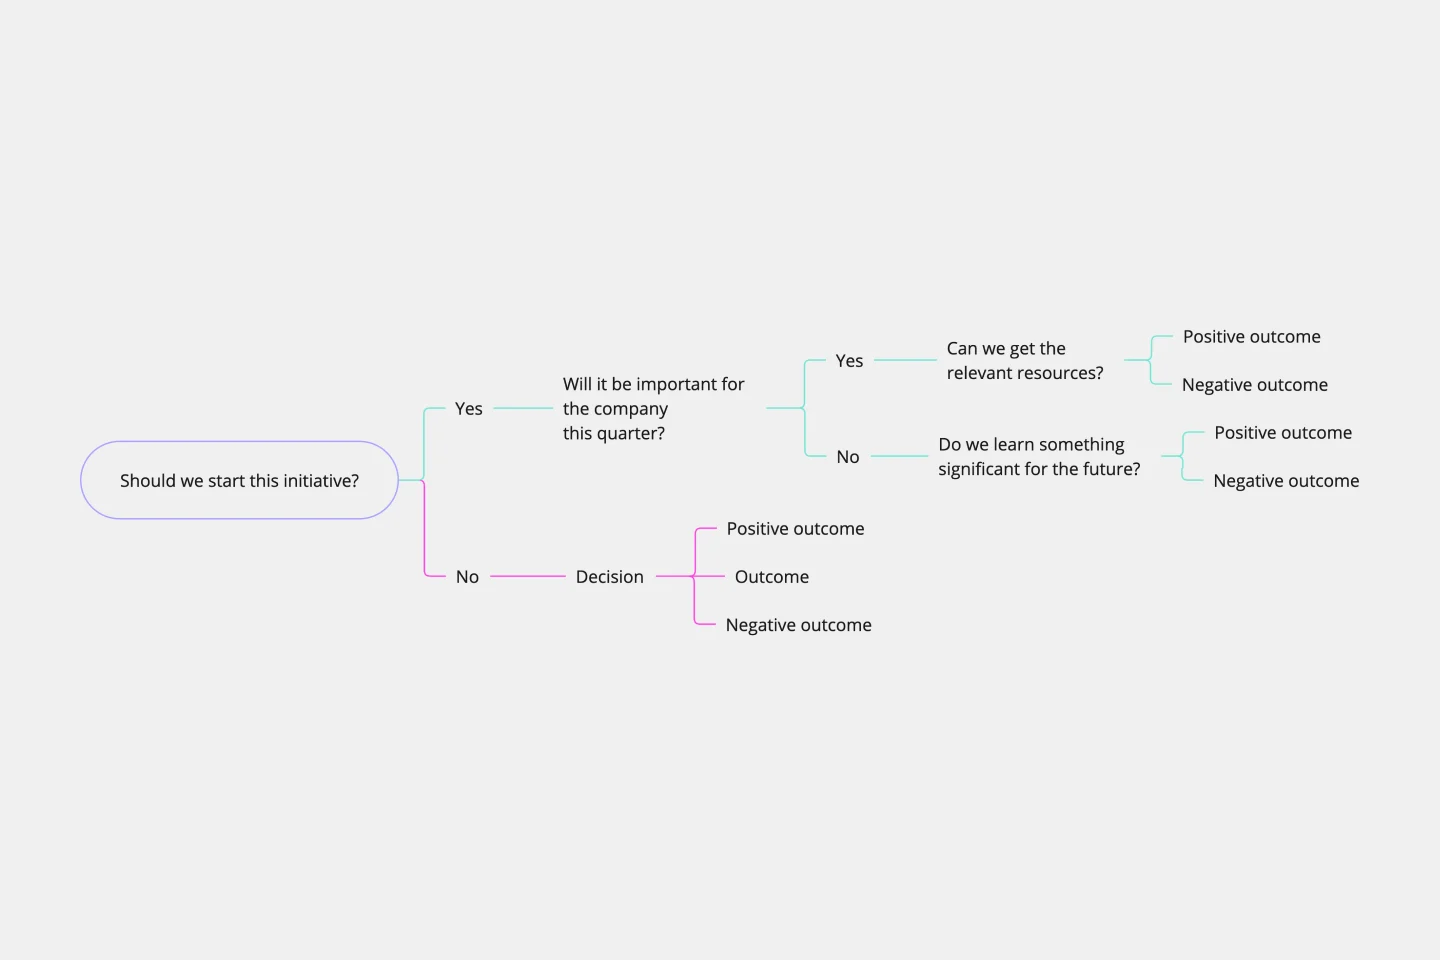
Making difficult decisions gets easier when you can look clearly at your choices and visualize the outcomes. That’s just what a decision tree will help you do, empowering you to invest your time and money with confidence. A decision tree is a flowchart that looks just how you’d imagine—with “branches” that represent your available choices. It provides a stylized way to play out a series of decisions and see where they lead before you commit your real-world resources, which is especially valuable for startups and smaller companies.
Data Flow Diagram Template
Works best for:
Flowcharts, Software Development, Diagrams
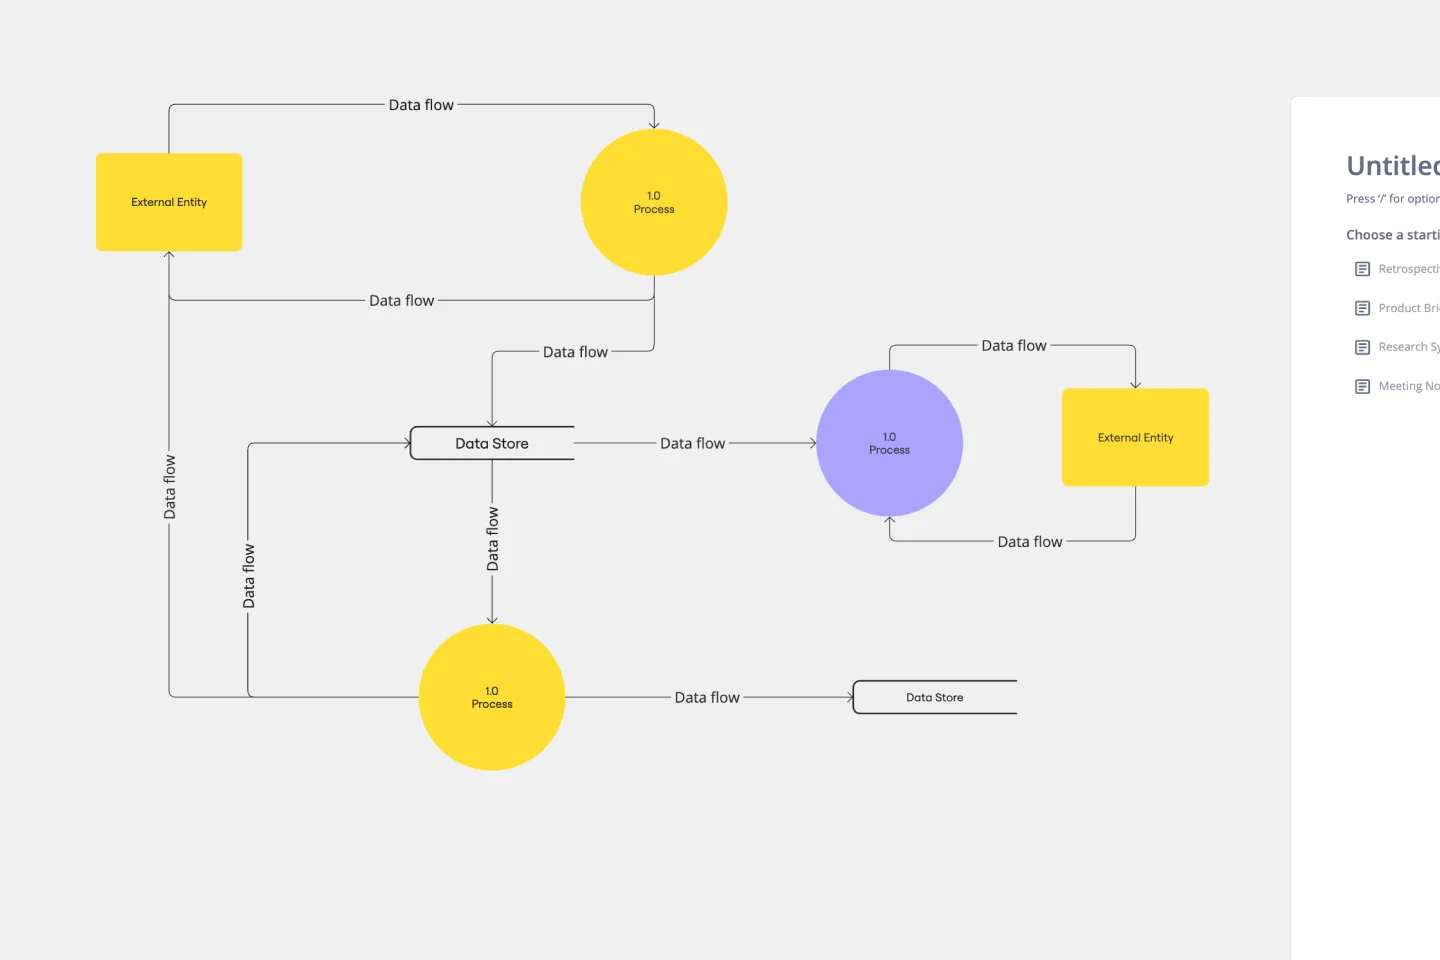
Any process can get pretty complex, especially when it has multiple components. Get a better grasp of your process through a data flow diagram (DFD). DFDs create a simple visual representation of all components in the flow of data and requirements in an entire system. They’re most often used by growth teams, data analysts, and product teams, and they’re created with one of three levels of complexity—0, 1, or 2. This template will help you easily build the best DFD for your process.
Double Bubble Map Template
Works best for:
Diagramming, Mapping, Brainstorming
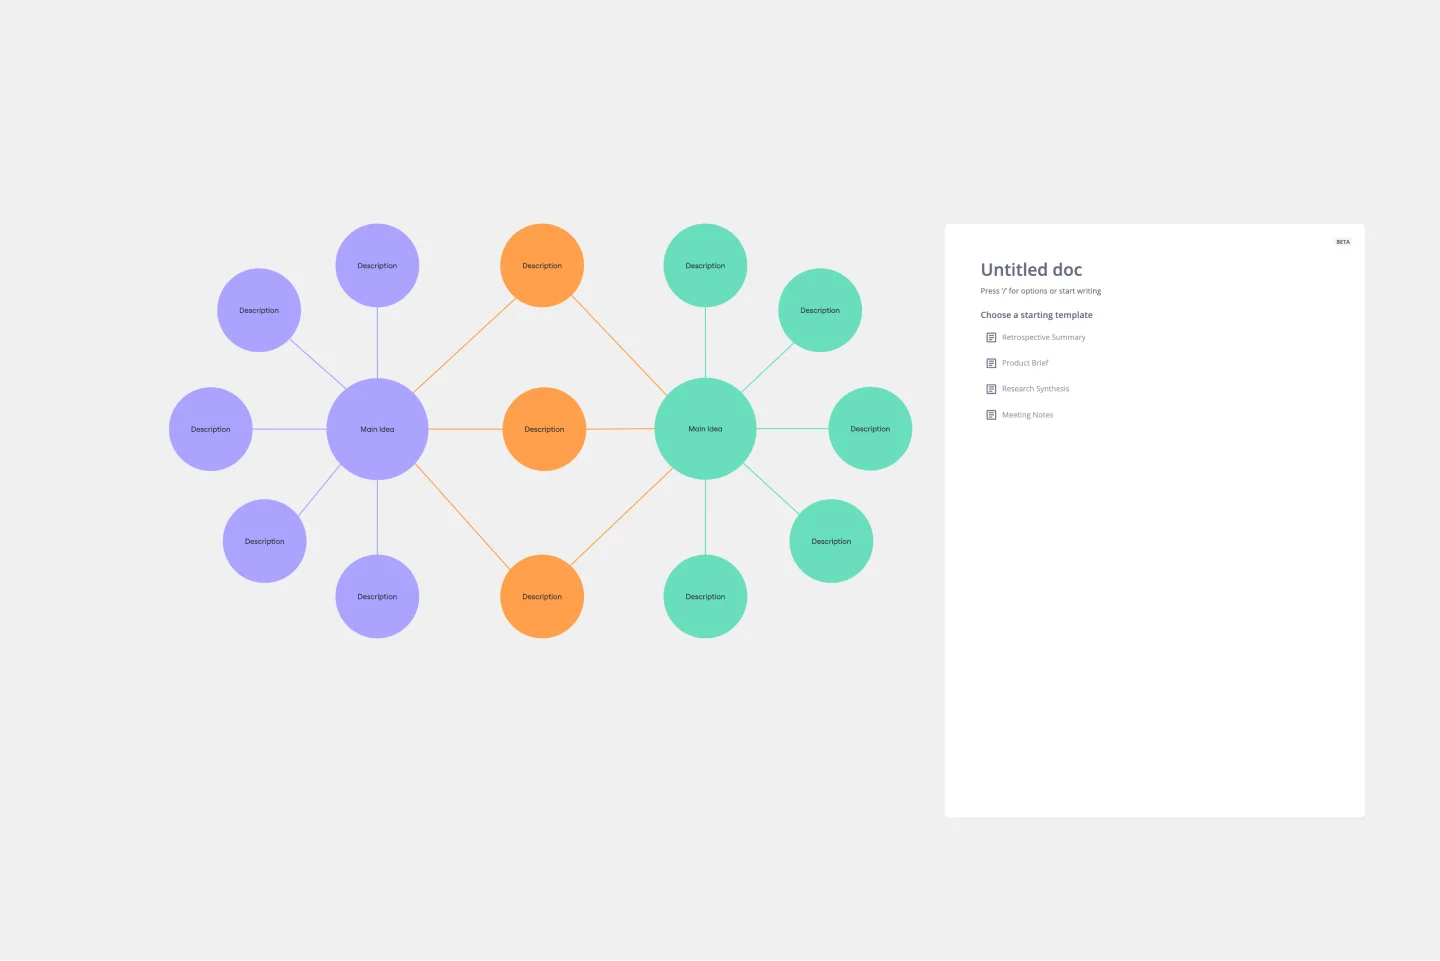
Double Bubble Map Template serves as a powerful tool to facilitate teamwork and streamline idea exploration. This adaptable template empowers teams to brainstorm, analyze, and compare concepts with ease, making it an invaluable asset for enhancing creativity and fostering clarity among team members.