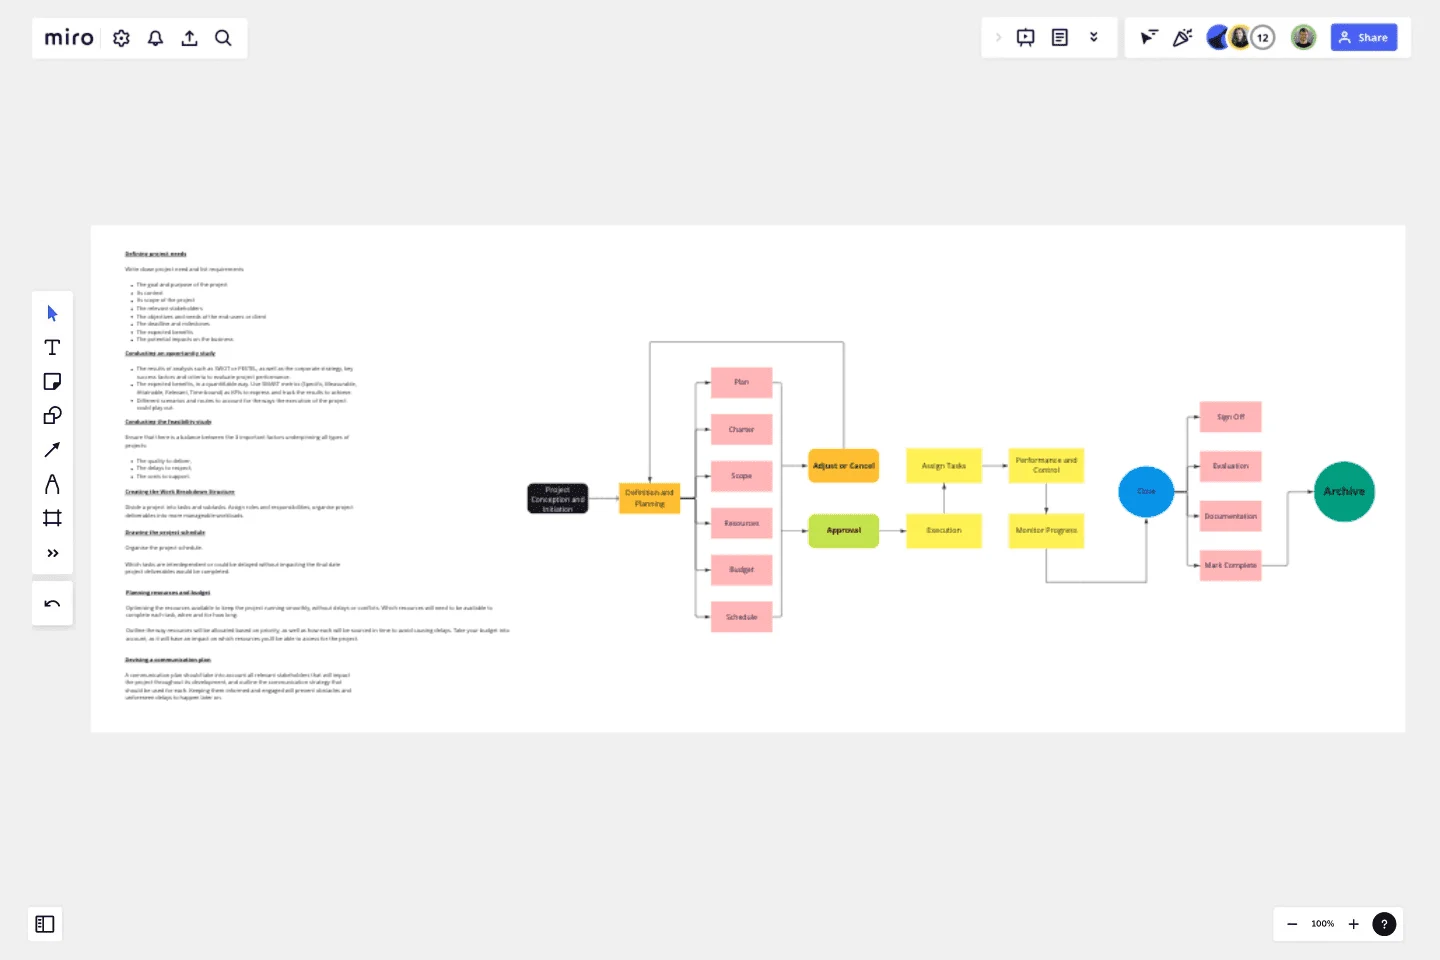
Project Management Flow Chart
A project management workflow is a sequence of tasks that need to be completed in order for a team or individual to complete a project, reach a goal, or finish a process step.
It’s a way of breaking down complex processes and projects into smaller steps and then sequencing those steps in a logical order that allows all parties to complete their tasks successfully.
Having good project management workflows in place is key for project managers and leaders who want to see work get done without stoppages, arguments, waiting on dependencies, or confusion about who does what and when.
In other words, if you want your teams to run smoothly and face fewer snags along the path toward project execution, you need to provide project management workflows to those teams.
This template was created by Sarah Moffatt. Discover more business flowchart examples to help you build the next big thing.
Get started with this template right now.
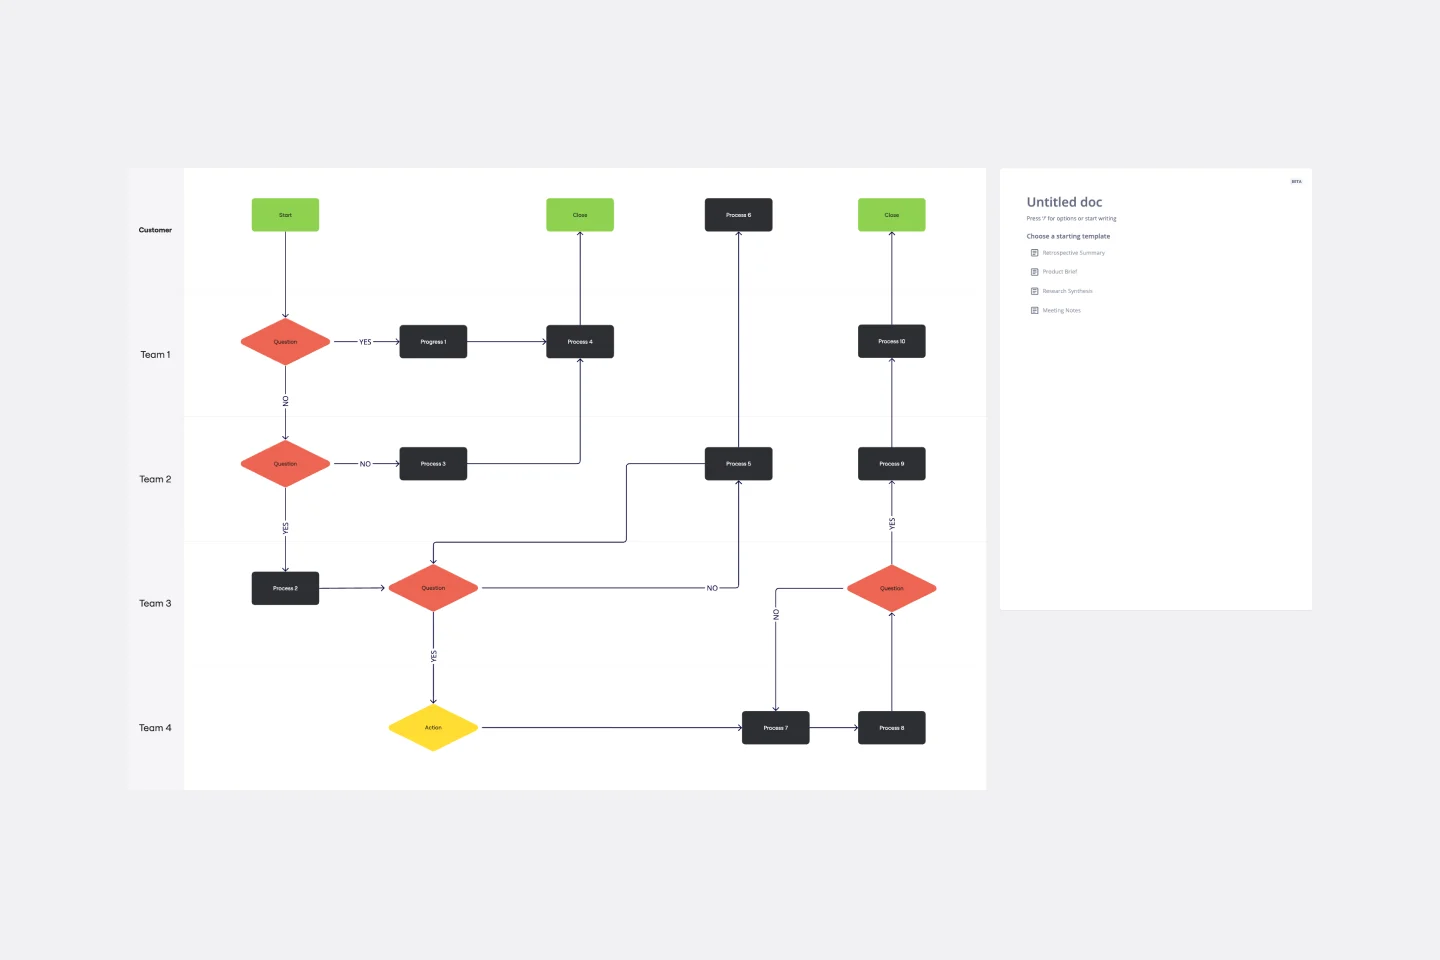
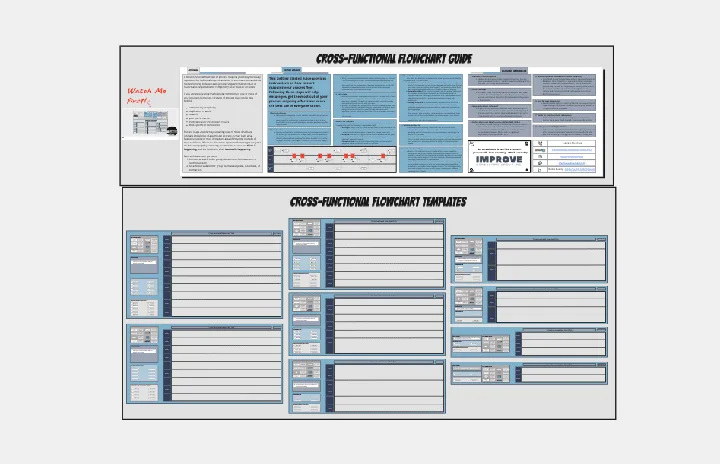
Cross Functional Flowchart
Works best for:
Org Charts, Business Management
Have a quick look at everyone on a project and see exactly what they’ll contribute. That’s the clarity and transparency a cross-functional flowchart will give you. These are also called “swim lane” flowcharts because each person (each customer, client, or representative from a specific function) is assigned a lane—a clear line—that will help you visualize their roles at each stage of the project. This template will empower you to streamline processes, reduce inefficiencies, and make meaningful cross-functional relationships.
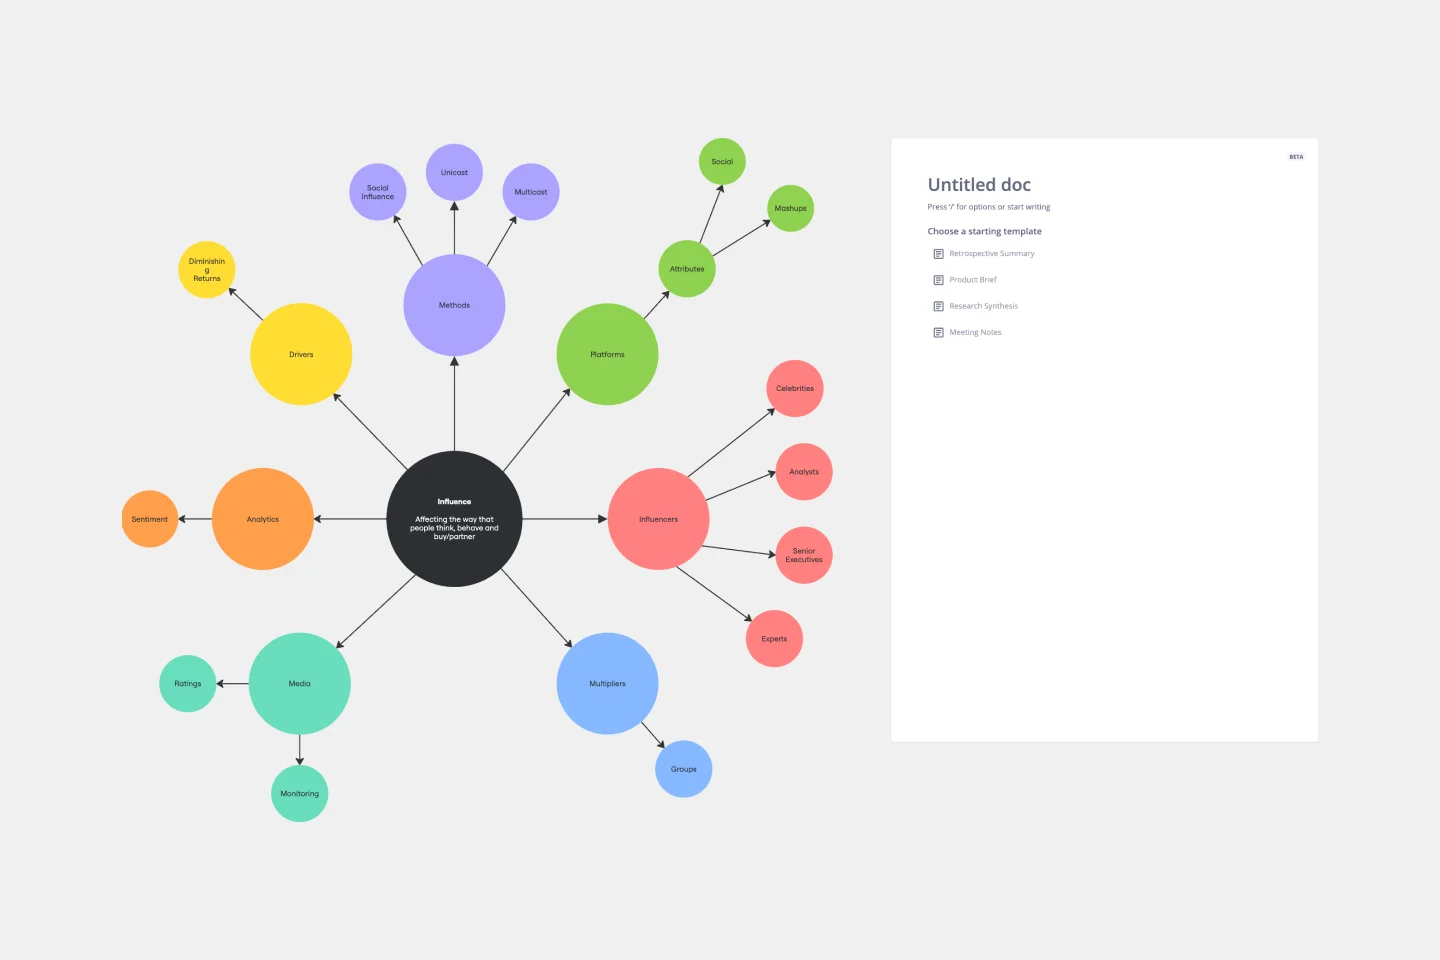
Cluster Diagram Template
Works best for:
Diagramming
The Cluster Diagram Template is a valuable tool for organizing and connecting ideas, concepts, and information in a visually compelling and coherent manner. The template's design centers on grouping related ideas around a core concept, creating a transparent and hierarchical structure. This clustering not only aids in breaking down complex information into manageable segments but also significantly enhances the process of idea generation and brainstorming. A structured yet flexible visual framework encourages deeper engagement and more precise understanding, making it an essential asset for teams and people looking to bring order to their creative and analytical processes.
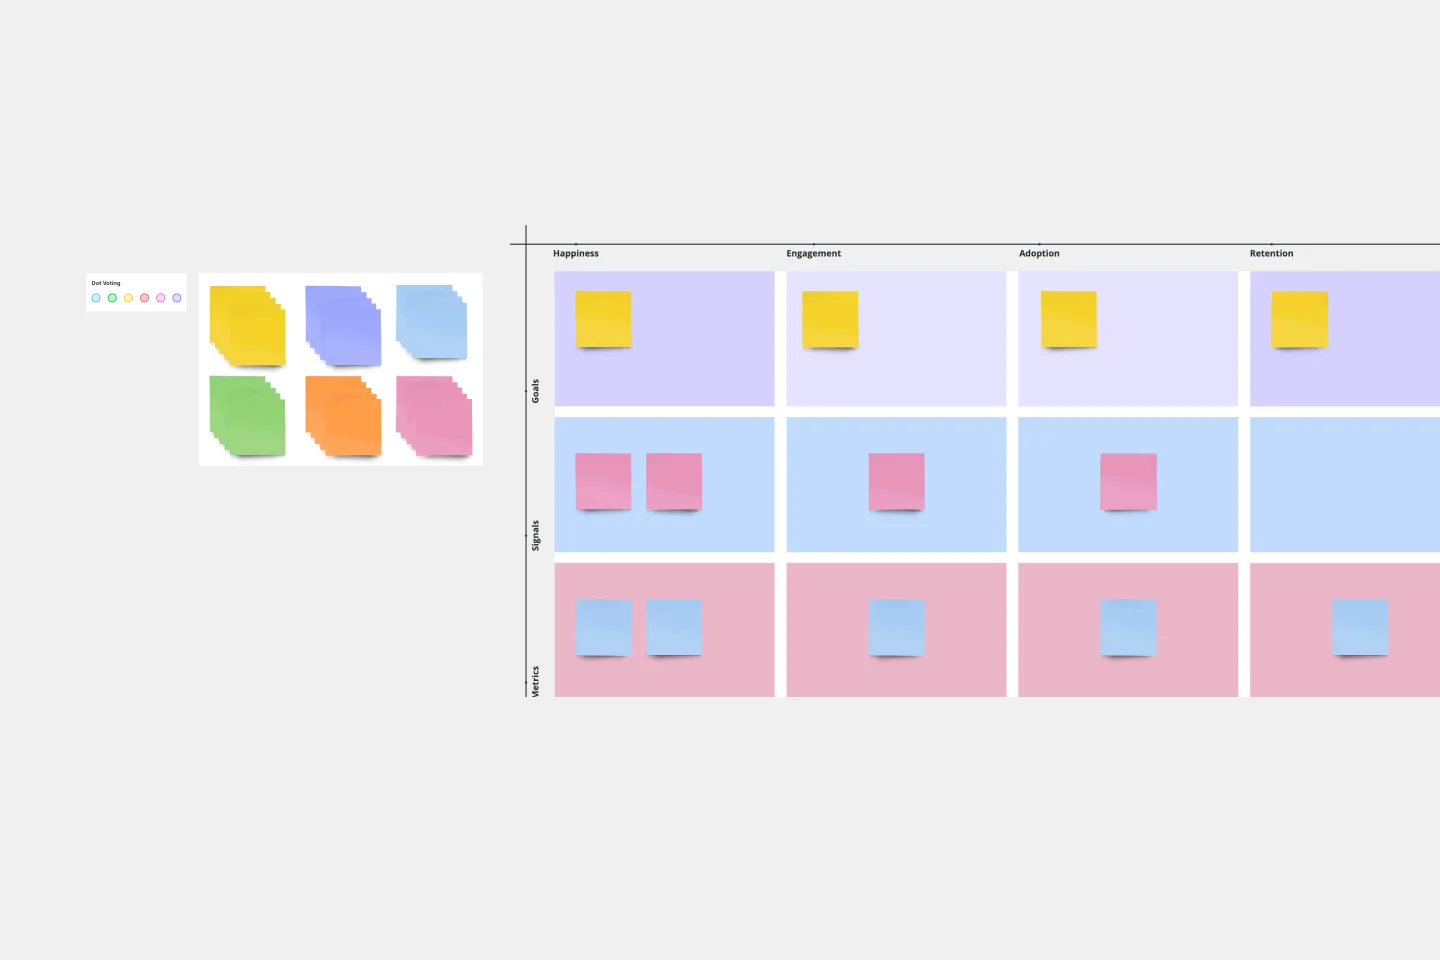
HEART Framework Template
Works best for:
Desk Research, Project Management, User Experience
Happiness, Engagement, Adoption, Retention, and Task Success. Those are the pillars of user experience — which is why they serve as the key metrics in the HEART framework. Developed by the research team at Google, this framework gives larger companies an accurate way to measure user experience at scale, which you can then reference throughout the product development lifecycle. While the HEART framework uses five metrics, you might not need all five for every project — choose the ones that will be most useful for your company and project.
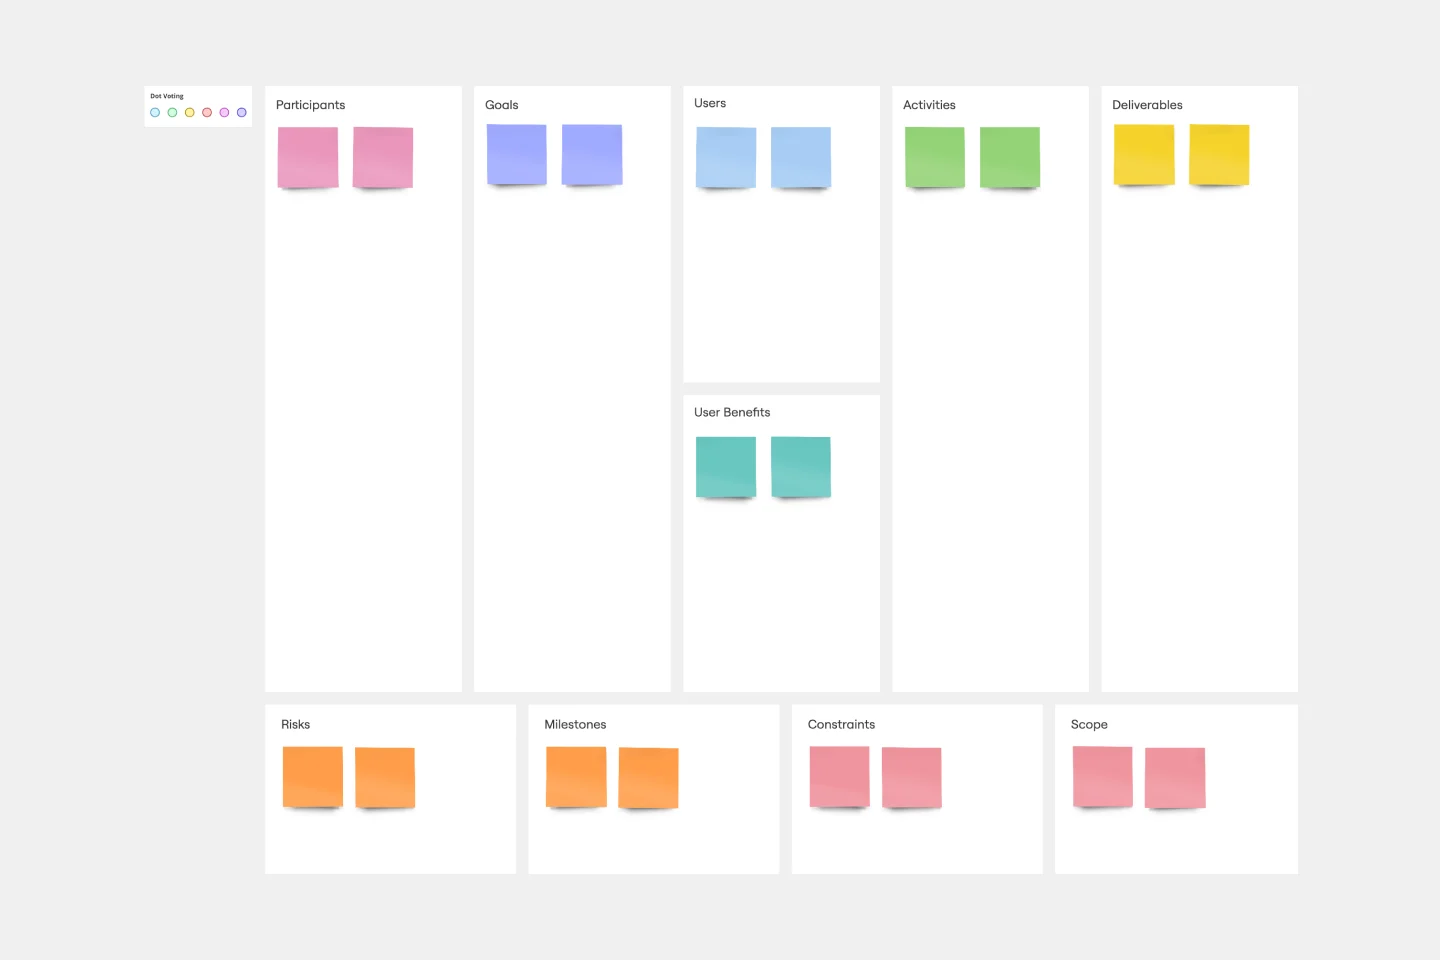
UX Project Canvas Template
Works best for:
User Experience, UX Design, Market Research
Inspired by Alexander Osterwalder's 2005 business model canvas, the project canvas will help your team visualize the big picture of your UX and design projects, providing a convenient structure that holds all of your important data. This innovative tool enables you to transform an idea into a project plan, stimulating collaboration and communication between collaborators. Unlike alternative models, the project canvas is a simple interface. There are few startup costs, and employees can easily be brought up to speed to start using the canvas quickly.
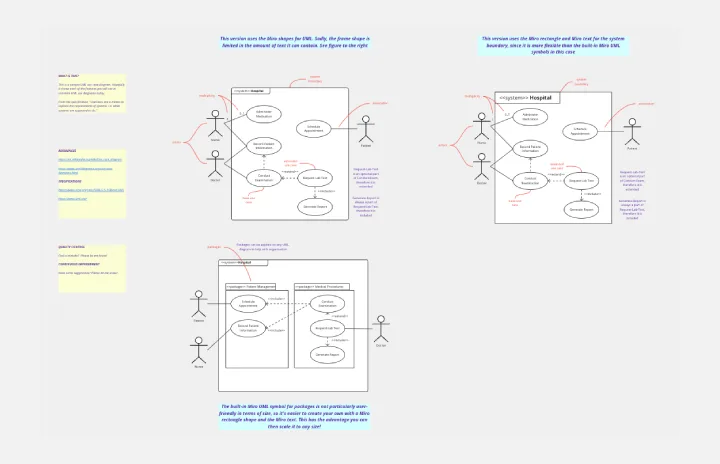
UML Use Case Diagram
Works best for:
UML Diagrams, Diagramming
Visualize system interactions with the UML Use Case Diagram. This template helps you map out user interactions and system processes, providing a clear overview of functional requirements. Ideal for software developers, business analysts, and project managers, it supports planning and communicating system functionalities. Use it to ensure all user scenarios are considered and to facilitate better design and implementation of software systems.
Cross-Functional Flowchart by Hiro Studio
Works best for:
Flowcharts, Flows
The Cross Functional Flowchart template is a visual tool for illustrating the sequence of steps and interactions between different departments or functional areas within an organization. It provides a structured framework for mapping out processes, identifying handoffs, and improving communication and collaboration. This template enables teams to visualize end-to-end processes, identify bottlenecks, and streamline workflows across functions. By promoting transparency and alignment, the Cross-Functional Flowchart empowers organizations to optimize processes and drive cross-functional collaboration effectively.