Project Organizational Chart Template
Use the project organizational chart template to structure the personnel on your upcoming project.
About the Project Organizational Chart Template
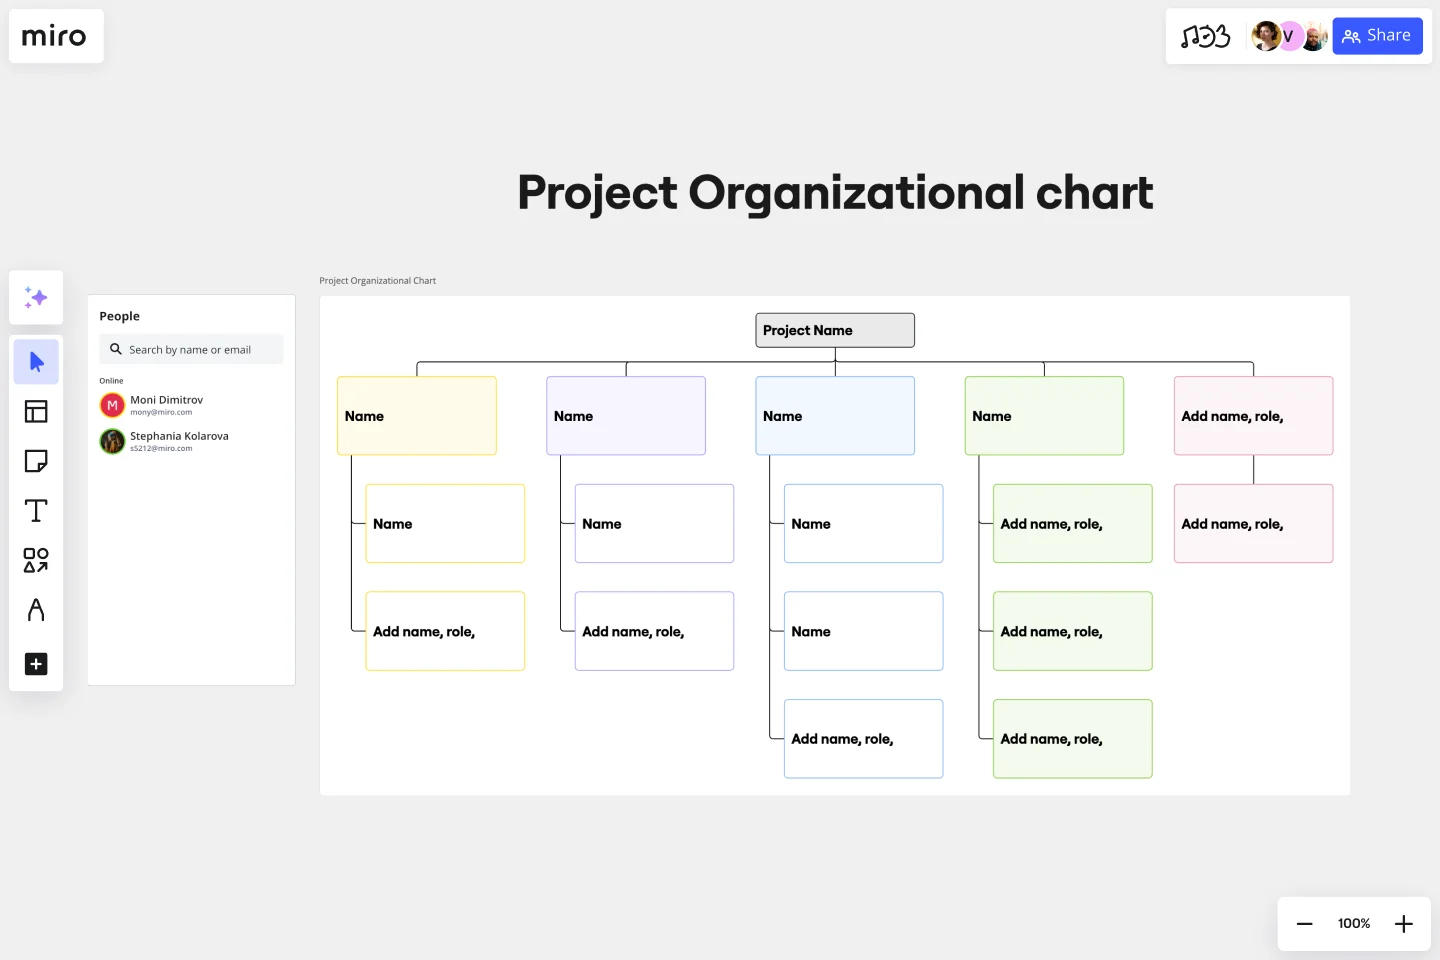
Miro’s project organizational chart template is a visual tool business owners and project managers can use to identify all the people involved in an upcoming project. By referring to the project organization chart, anyone can see each person’s role, the hierarchy among personnel, and the chain of command. When effectively mapped, a project organization chart is a great resource for aligning expectations on responsibilities among all the people involved in a project.
We’ll walk you through how to use Miro’s free project organizational chart template and customize it to your liking.
How to use the project organization chart template
Now that we know what a project organization chart is and why they’re helpful, let’s look at how to create one. Here are a few steps you can take to get started with Miro’s project organizational template:
1. Open Miro’s project organizational chart template
Click on the blue “use template” button on this page to open the template in Miro. Once you’re in, invite any teammates you’d like to collaborate on your project organization chart with.
2. Identify the people who will be involved
Identify who will be involved in your project. Not sure where to start? It’s worth assembling a senior management team and project coordinators.
Your senior management team comprises stakeholders — people who are interested in the outcome of your project, are invested in its success, and are committed to obtaining your expected outcomes. Project coordinators will synchronize and integrate team activities. They’re responsible for ensuring everyone is on task and working toward the goal.
3. Name people on the chart
The project organizational template comes with pre-made rounded rectangles where you can name different people involved in the project. Double-click on the text boxes within them to replace the pre-written names with your teammates’s names. Add their roles and any other important details you’d like to include, such as their email addresses. Duplicate or remove any shapes and connection lines as needed.
4. Customize your project organization chart
Miro makes it easy to customize the look and feel of your project organization chart. Change the sizes and colors of your shapes and text. Drag and drop any of your own files you’d like to include on your Miro board, such as headshots of each team member or important documents for the project.
Why use a project organizational chart
When you’re embarking on a long and complex project, you’ll inevitably hit roadblocks. Your project organization chart can help you overcome those challenges. Let’s look at this (and a few other benefits) in more detail.
Identify roadblocks
Use the chart to identify any project roadblocks before things get underway. That way, you can rectify problems before it’s too late. For example, laying out the chart might show that you need more salespeople involved in the project. Because things haven’t started yet, you have time to get more salespeople involved to ensure the project runs smoothly.
Clarify everyone's role in the project
A project organization chart helps employees understand their role in the project. It shows them the reporting structure and who to communicate with if they need specific tools or resources. You can also supplement your project organizational chart with a team charter to help articulate your team’s mission, scope of operation, objectives, and commitment.
Maximize the skills of all team members
Using an organizational chart for a project makes it clear which team members will be performing certain tasks. This means you can make sure that all tasks are being completed by team members with skills in those areas. For example, you can make sure that a marketing copywriter is writing new website copy.
Miro is the perfect organizational chart maker to help visualize and understand your organization's hierarchical structure and reporting lines between roles.
Do I need a template to make a project organization chart?
It’s not vital, but using a template will likely save you time and maintain consistency across your charts. Having all your project personnel laid out in a hierarchical chart makes it easier to visualize the project. It’ll also bring any gaps to light so you can fill all the roles before going live. For people involved in the project, seeing the chart allows them to see their role in the bigger picture. It also shows them who they need to report to and who they should turn to if they have questions or concerns.
How do you structure a project management team?
First, define your project objectives. Knowing the overall goal will help you create a relevant project management team. Now, select the team members best suited to help you reach these objectives. You’ll then create the organizational structure based on the hierarchical relationships in the company and the project.
What can you do with a project organization chart?
A project organization chart can help with resource management, planning stakeholder communication, and allocating roles and responsibilities. Creating one can also be the first step in forming a detailed organizational breakdown.
Who to include in your project organization chart?
You should include anyone in the core team structure who’s working on the project, including the project manager, the project sponsor, major stakeholders, and individual contributors.
Get started with this template right now.
UML Class Content Management System (CMS) Template
Works best for:
UML
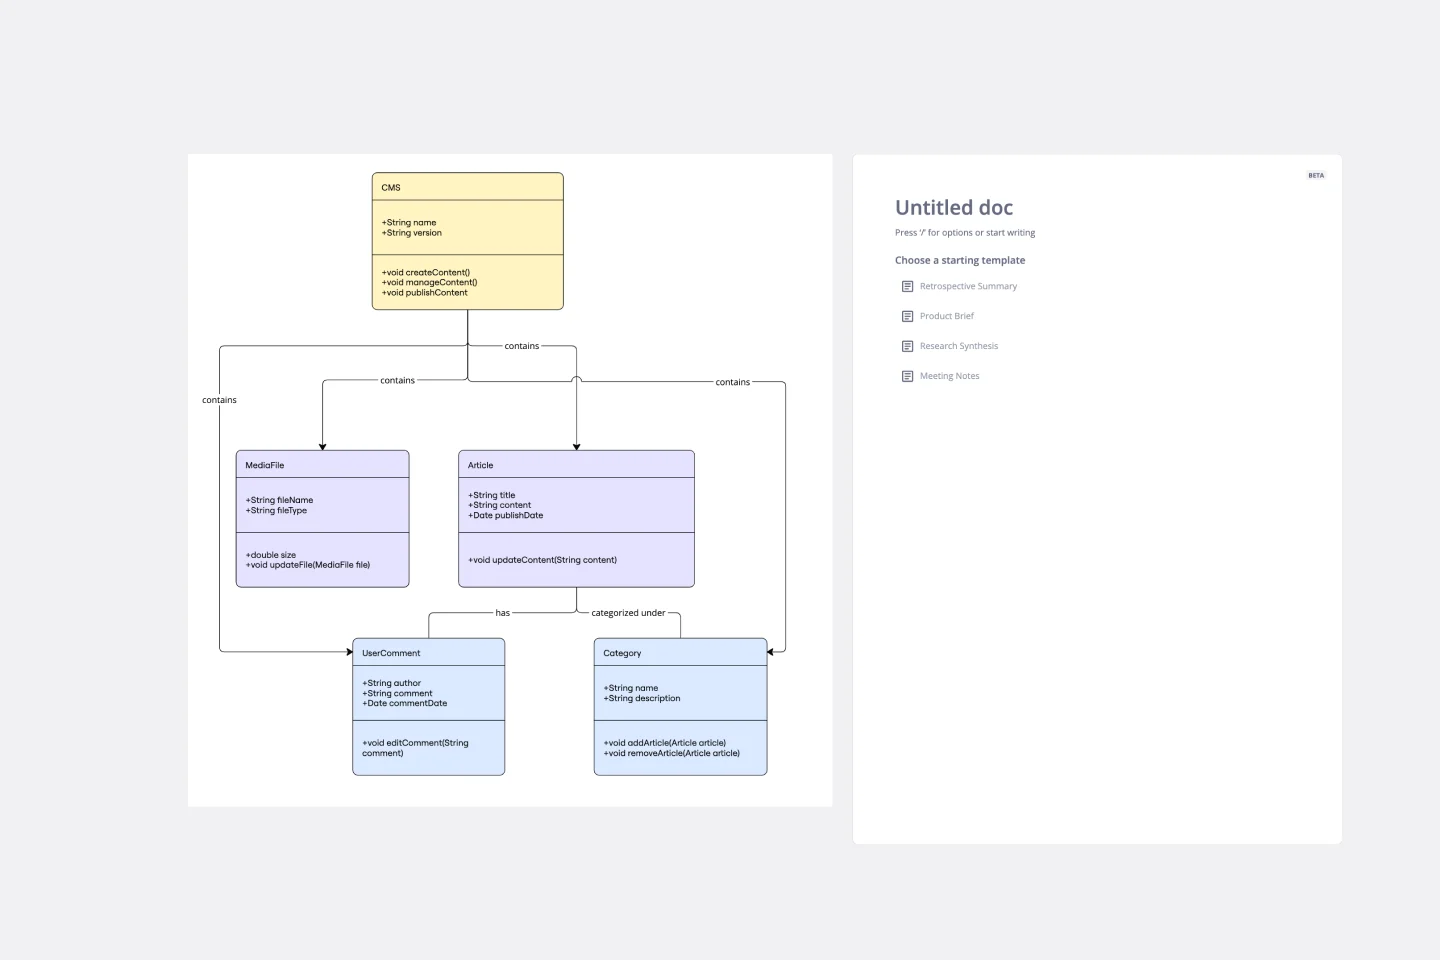
The UML Class Content Management System CMS Template simplifies documenting and designing the architecture of a Content Management System. It allows for the creation of UML class diagrams to visualize the structure of a CMS. Teams can efficiently map out key classes and their interactions, such as how users create, manage, and publish digital content. The template's integration into Miro's collaborative platform allows for real-time teamwork, customization, and easy sharing of feedback. This streamlines the documentation process and is valuable for software development projects aiming to develop or refine a CMS.
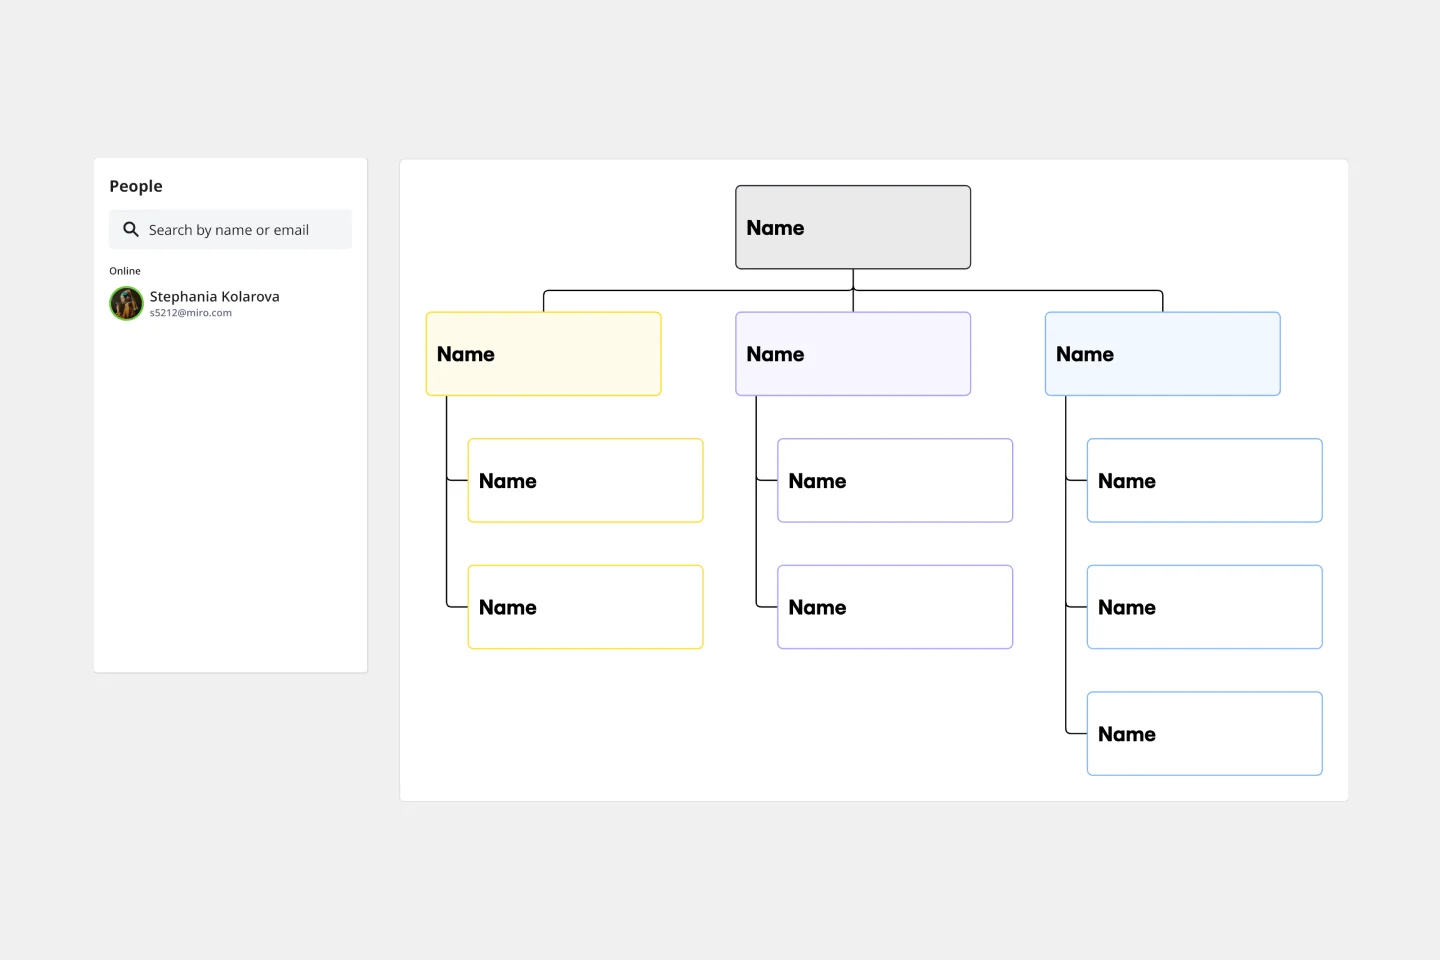
Skill Gap Analysis Org Chart Template
Works best for:
Diagramming
The Skill Gap Analysis Org Chart Template helps organizations optimize their workforce by assessing and addressing skill gaps. It integrates skill analysis with succession planning, identifies leaders, and fosters cross-functional collaboration. This template aligns employee skills with organizational objectives for sustained success.
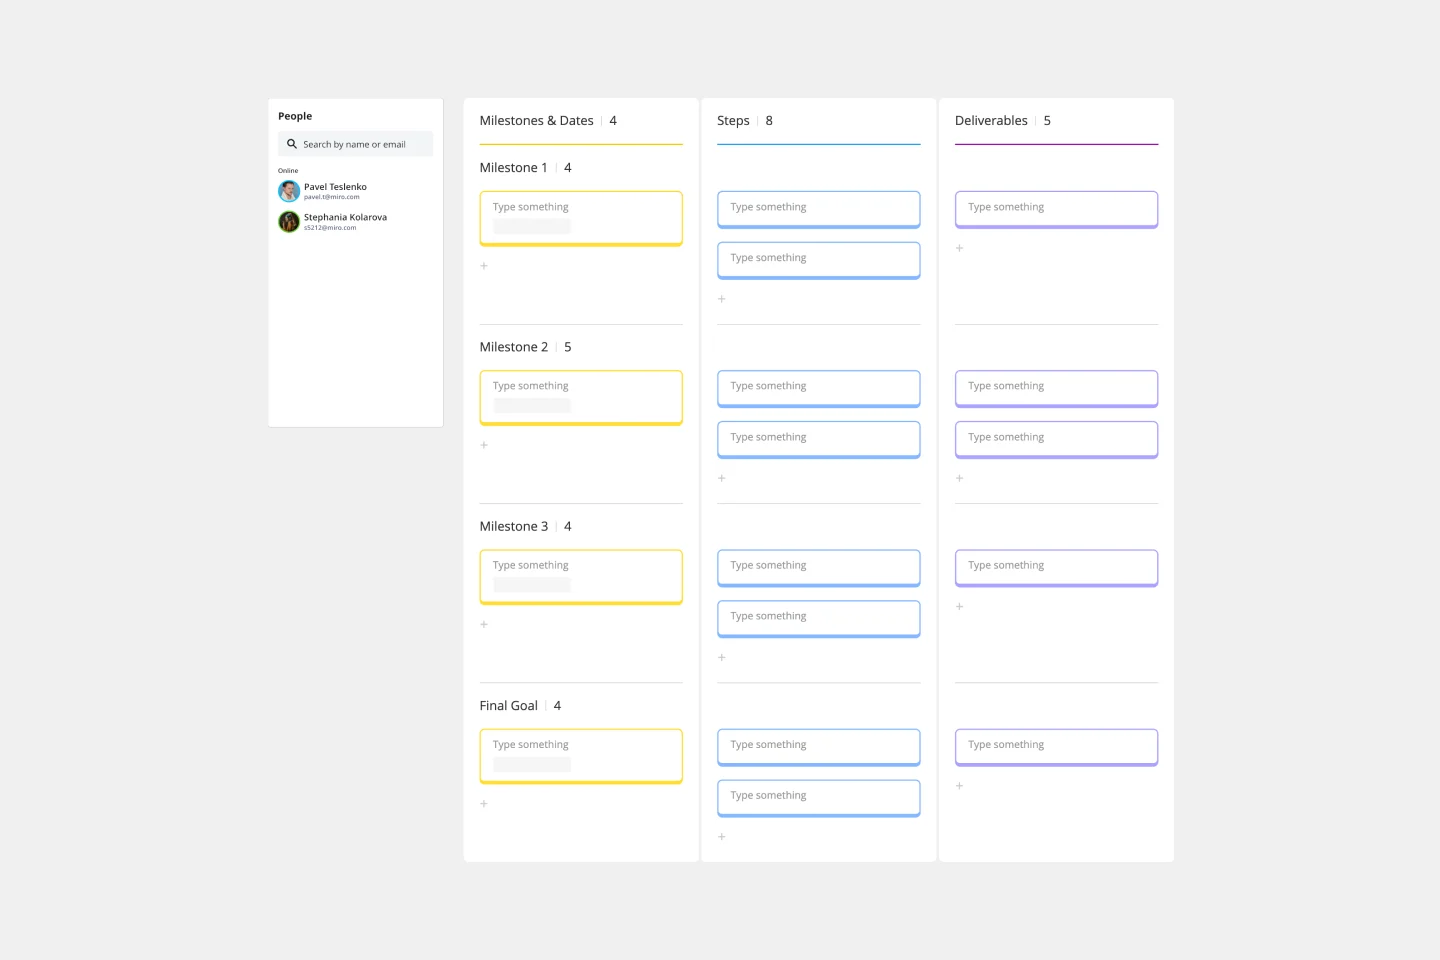
Milestone Chart Template
Works best for:
Project Management, Strategic Planning, Project Planning
When your team is collaborating on a large project, keeping track of the many tasks and multiple timelines can be a challenge. That’s why you need a milestone chart. These visual representations of important project events will make it simple for your team to stay on schedule and reach goals on time. And it’s so easy to get started — just determine the major milestones, use our template to create a milestone chart, and define the key dates and deliverables each milestone will require.
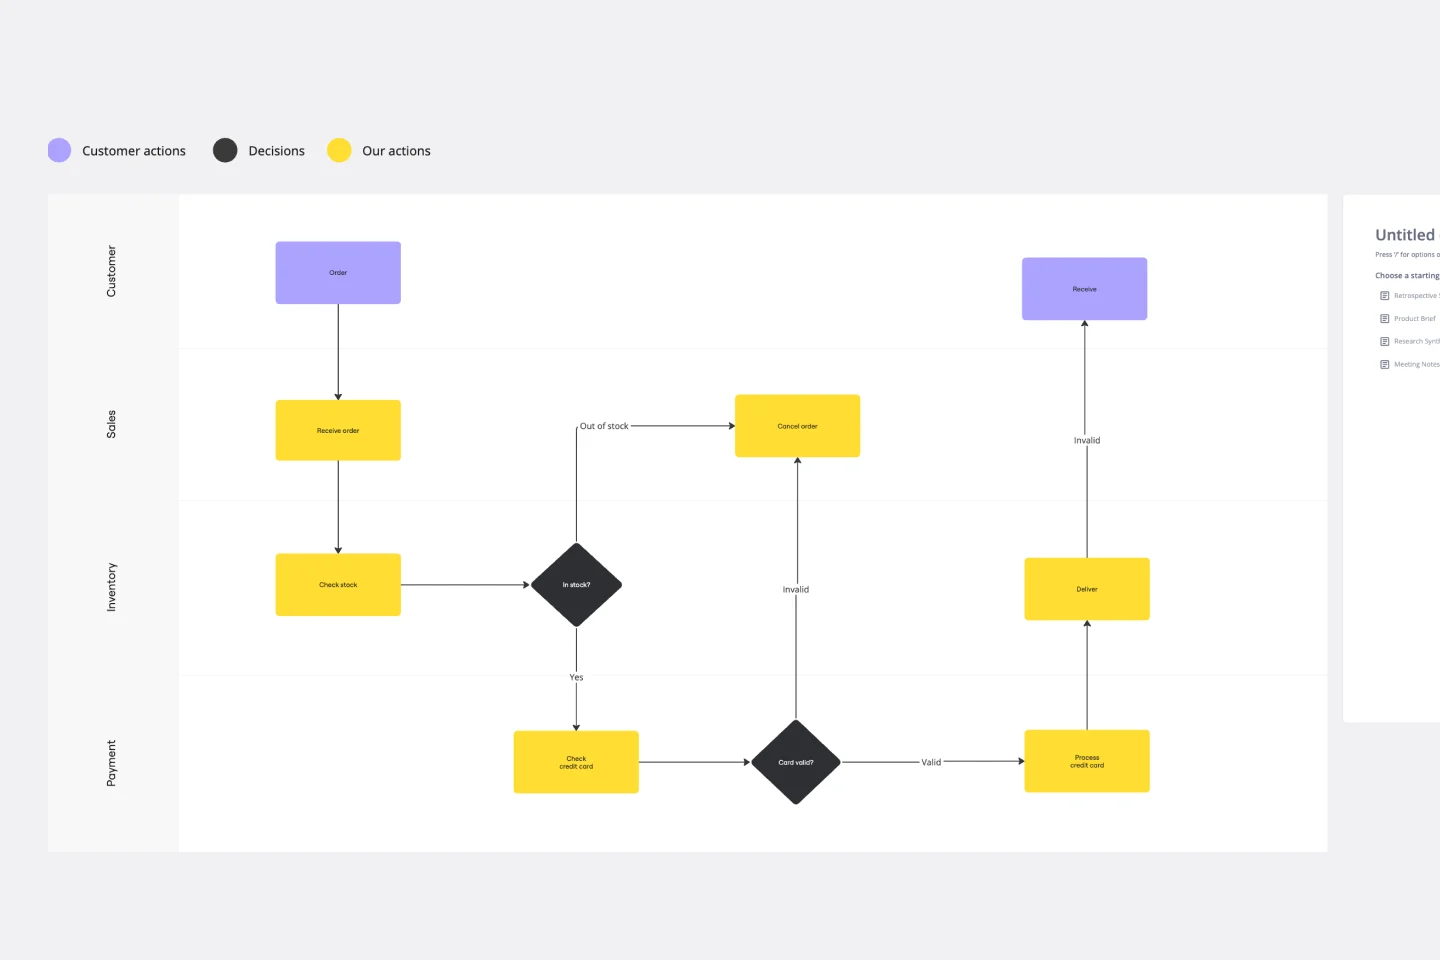
Swimlane Diagram Template
Works best for:
Flowcharts, Diagrams, Workflows
A swimlane diagram shows you which stakeholders are responsible for each area of your critical processes. You can use it to understand current processes or plan new ones.
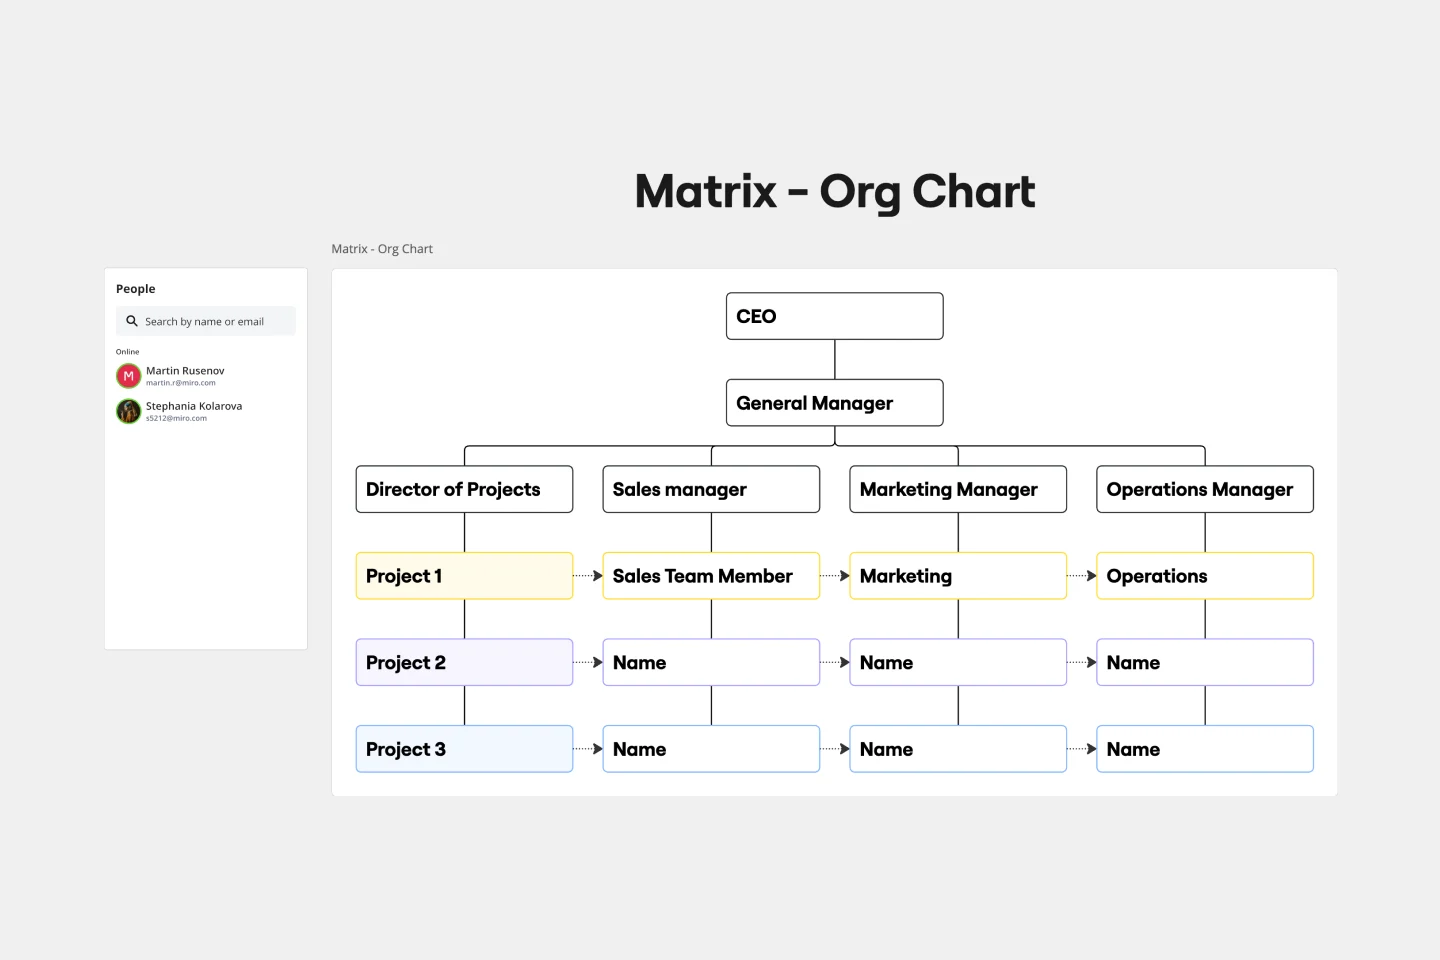
Matrix Org Chart
Works best for:
Organizational Charts, Diagramming
The matrix org chart template organizes teams efficiently and promotes effective communication. It is an essential tool for businesses that require complex decision-making capabilities and rapid response times. With this template, people can easily visualize their roles, responsibilities, and relationships within the organization, leading to improved alignment and performance.
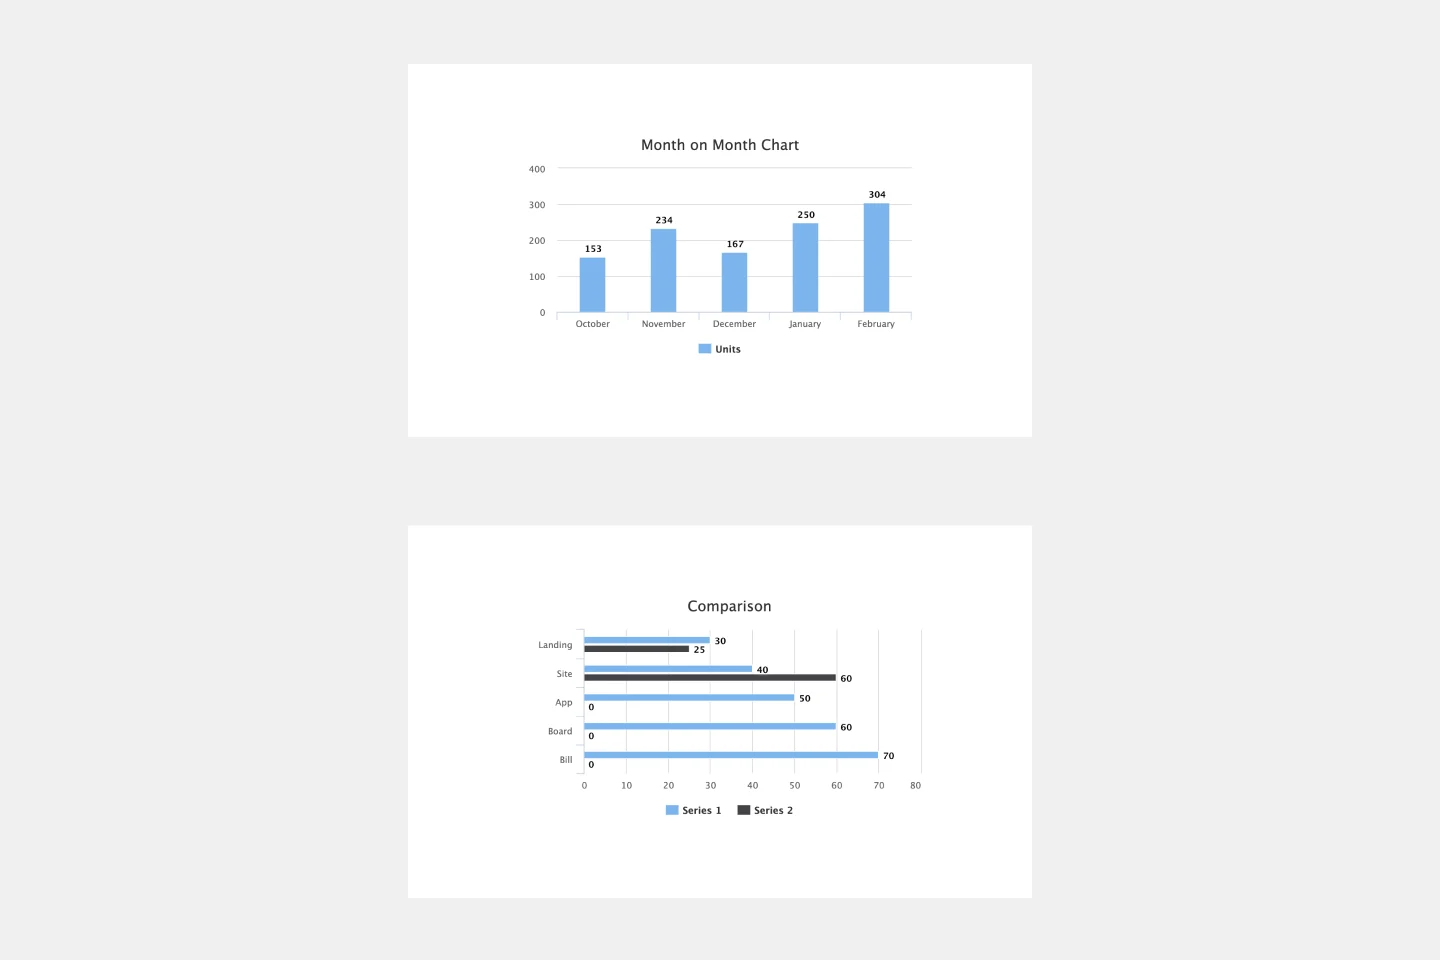
Bar Graph Template
Works best for:
Operations, Diagrams
Bar graphs are an excellent way to compare different types of categories and datasets visually. Many professionals use this type of graph to support their presentations and make data storytelling more understandable. With just a few clicks, use this bar graph template and customize it according to your needs.