Strategic Group Mapping Template
Easily define your competitive landscape using the Strategic Group Mapping Template. From understanding your product position to analyzing competitors, this template empowers anyone to visualize market competition seamlessly.
About the Strategic Group Mapping Template
We know that in the complex landscape of business strategy, it's crucial to have tools that can simplify our processes and offer clarity. Enter Miro's Strategic Group Mapping Template - designed to help you visually represent the competitive positions of different companies or products in your market.
What's a Strategic Group Mapping Template?
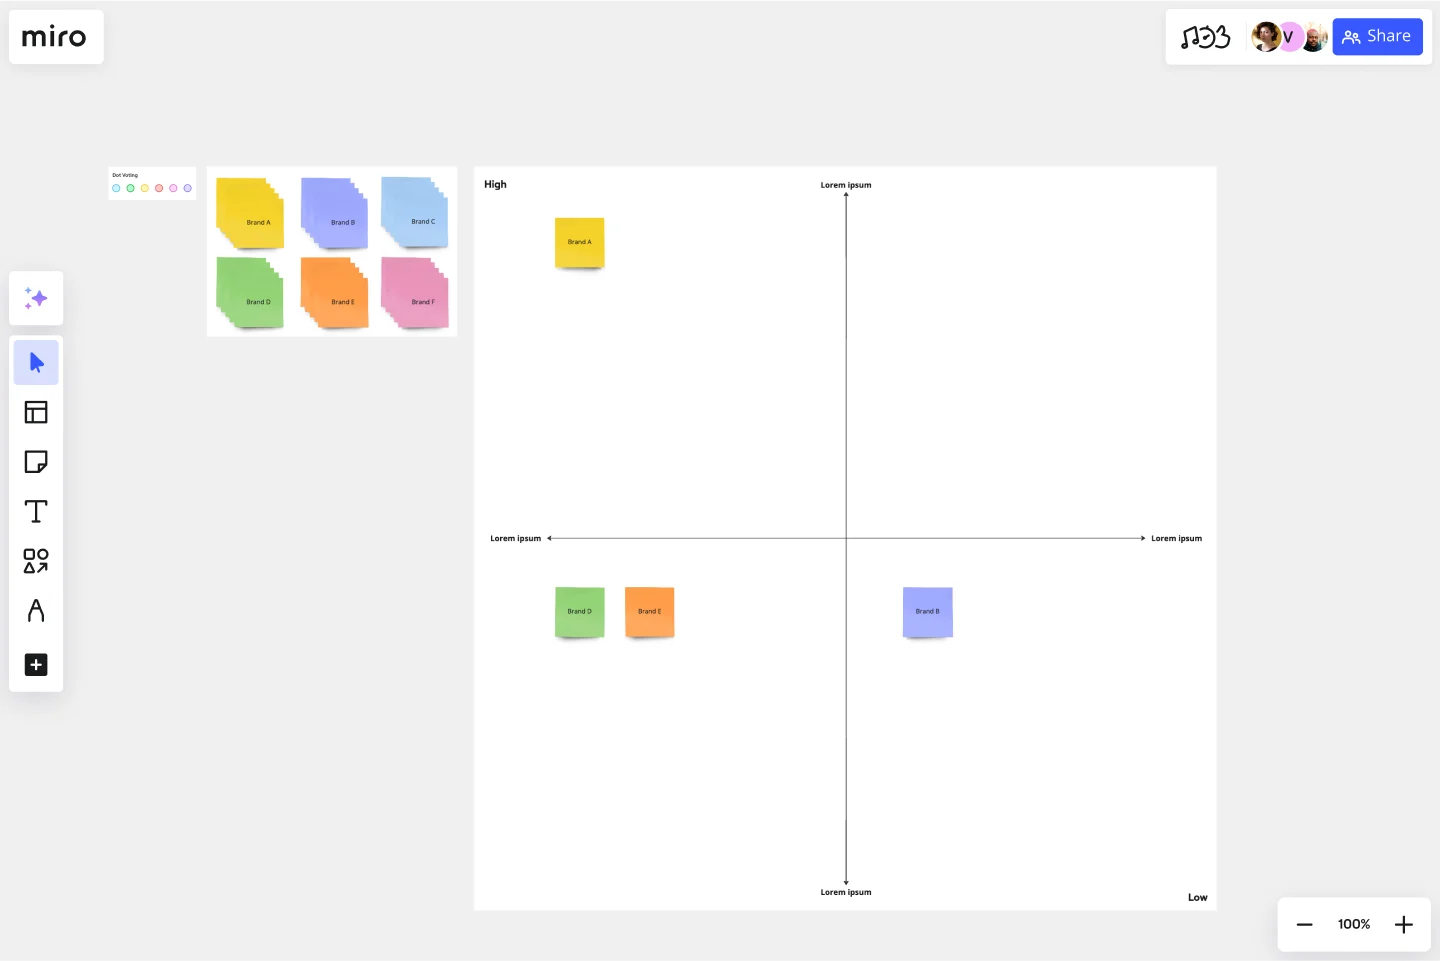
A Strategic Group Mapping Template is a visual tool that helps you plot out the competitive position of various entities within a market based on specific criteria. You can gain insights into market positions, potential market spaces, and competition intensity by placing competitors into different strategic groups based on key dimensions such as price range or product quality.
What are the benefits of using a Strategic Group Mapping Template?
Visual representation: By mapping competitors on a visual workspace, businesses can quickly identify clusters of similar competitors and gaps in the market.
Informed decision-making: It provides a clearer picture of where your business stands, aiding in more strategic decisions regarding market entry or product development.
Facilitates collaboration: As a shared template, teams can collaborate in real time, brainstorming and drawing insights together.
Enhances competitive analysis: Enables companies to identify potential threats or opportunities by visualizing where competitors are clustered and where market spaces are less dense.
How to use a Strategic Group Mapping Template in Miro?
Miro is flexible and interactive, making it a perfect place for strategic mapping. Here's how you can create one:
Open a new board: Select the Strategic Group Mapping Template in the Templates Library.
Use shapes: Edit the shapes on the template, or add more from Miro's shapes library. For your X and Y axis criteria, you can use lines and label them appropriately. Drag circles, rectangles, or other shapes to represent different companies or products.
Customize and position: Adjust the size, colors, and positions of shapes based on the relative position of competitors. The drag-and-drop feature ensures ease of positioning.
Collaborate: Invite team members to join your board and input their insights, ensuring a comprehensive mapping.
Discover more competitive analysis examples that you can use right away.
What criteria should I use for the axes on the map?
It varies by industry and what you're analyzing. Common criteria include price, quality, market share, product range, and geographical coverage.
How often should I update my strategic group map?
It's essential to update your map periodically, especially when there are significant market changes, new entrants, or shifts in competitor strategies.
Can multiple team members edit the map simultaneously?
Yes, Miro allows real-time collaboration, so multiple members can edit, comment, and brainstorm together on the same map.
Get started with this template right now.
Entity–Relationship Diagram (ERD) HR Management System Template
Works best for:
ERD
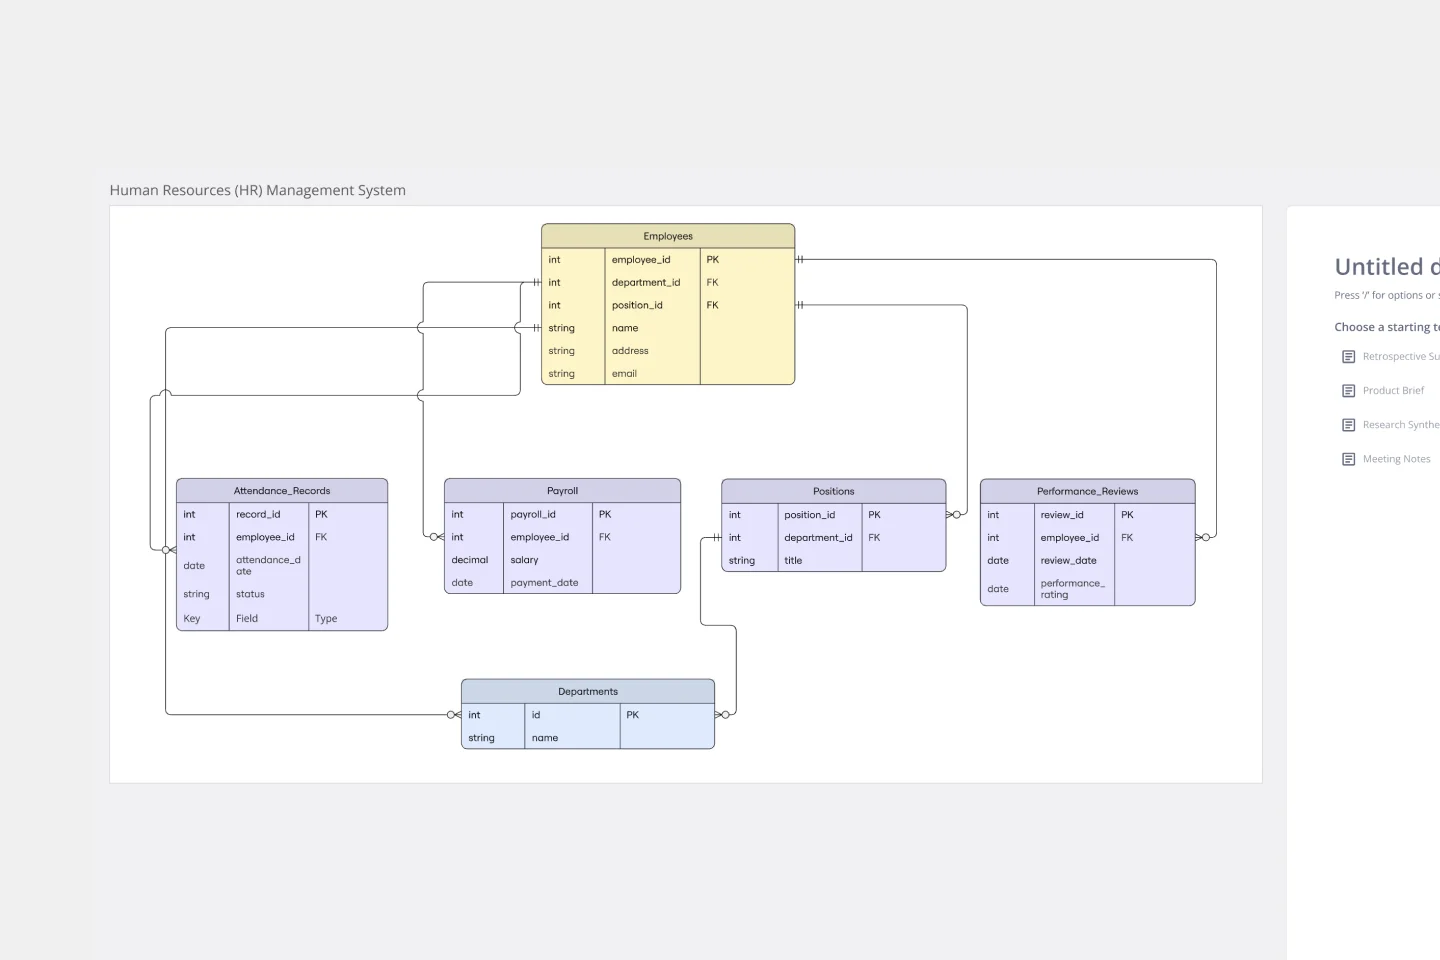
The Entity–Relationship Diagram (ERD) HR Management System Template in Miro is designed to streamline the management of employee-related information and processes within an organization. This template allows for the visualization and organization of complex HR systems, making it easier to understand relationships and processes. It enables users to map out departments, positions, and employee details, including attendance records, payroll, and performance reviews.
UML Sequence Deployment Pipeline Template
Works best for:
UML
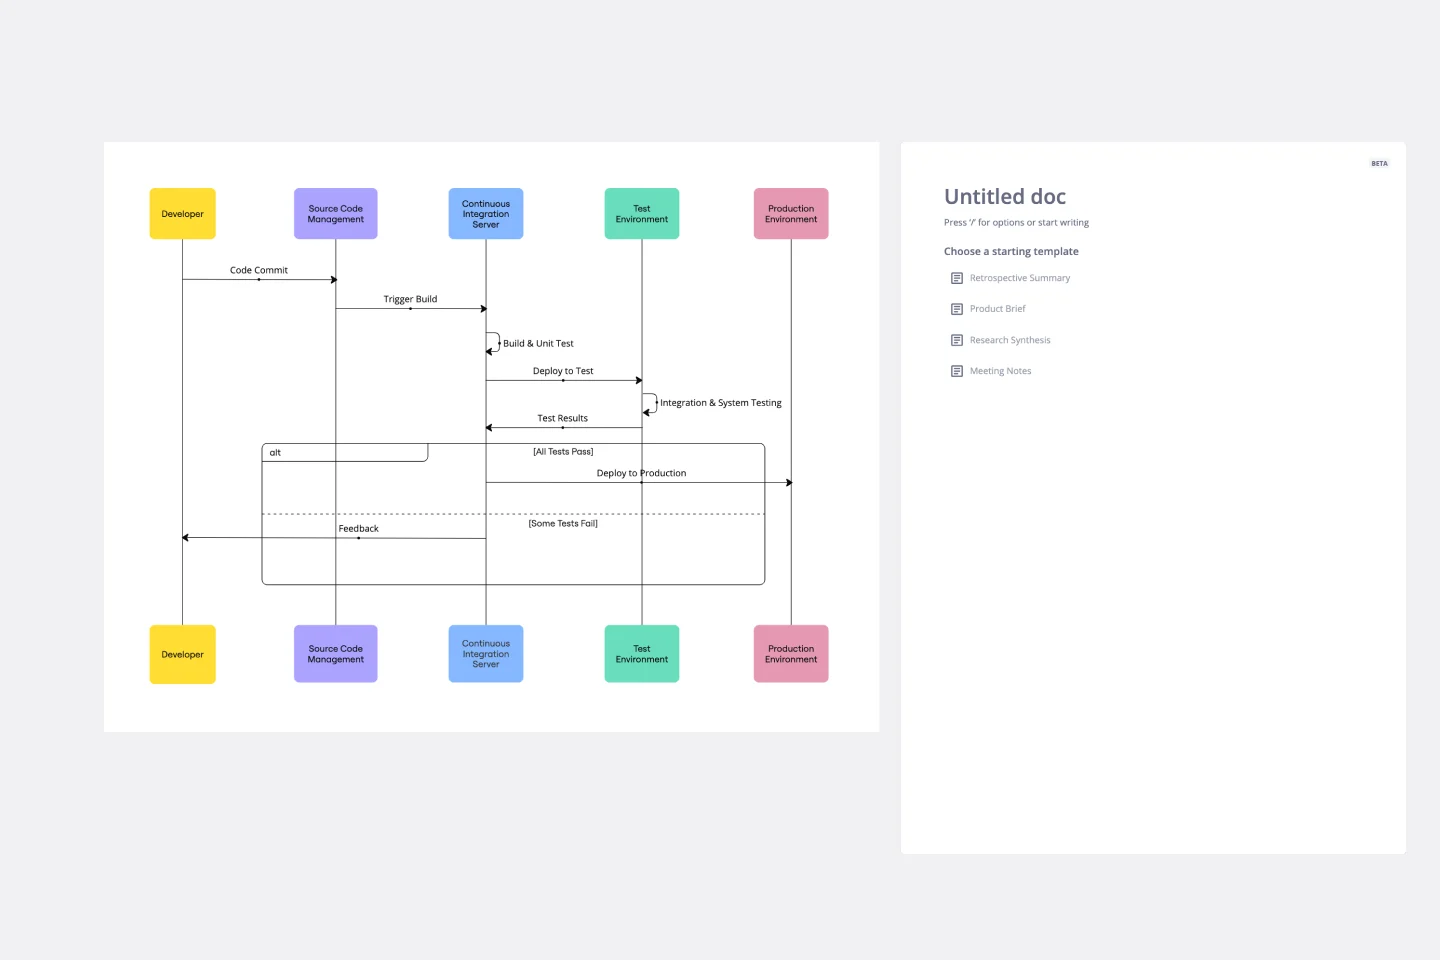
The UML Sequence Deployment Pipeline Template in Miro visually maps the sequence of steps in an automated deployment pipeline, helping teams in software development and deployment. It helps identify bottlenecks, standardizes the deployment process, and facilitates new member onboarding for continuous improvement.
UML Diagram Template
Works best for:
Diagrams, Software Development
Originally used as a modeling language in software engineering, UML has become a popular approach to application structures and documenting software. UML stands for Unified Modeling Language, and you can use it to model business processes and workflows. Like flowcharts, UML diagrams can provide your organization with a standardized method of mapping out step-by-step processes. They allow your team to easily view the relationships between systems and tasks. UML diagrams are an effective tool that can help you bring new employees up to speed, create documentation, organize your workplace and team, and streamline your projects.
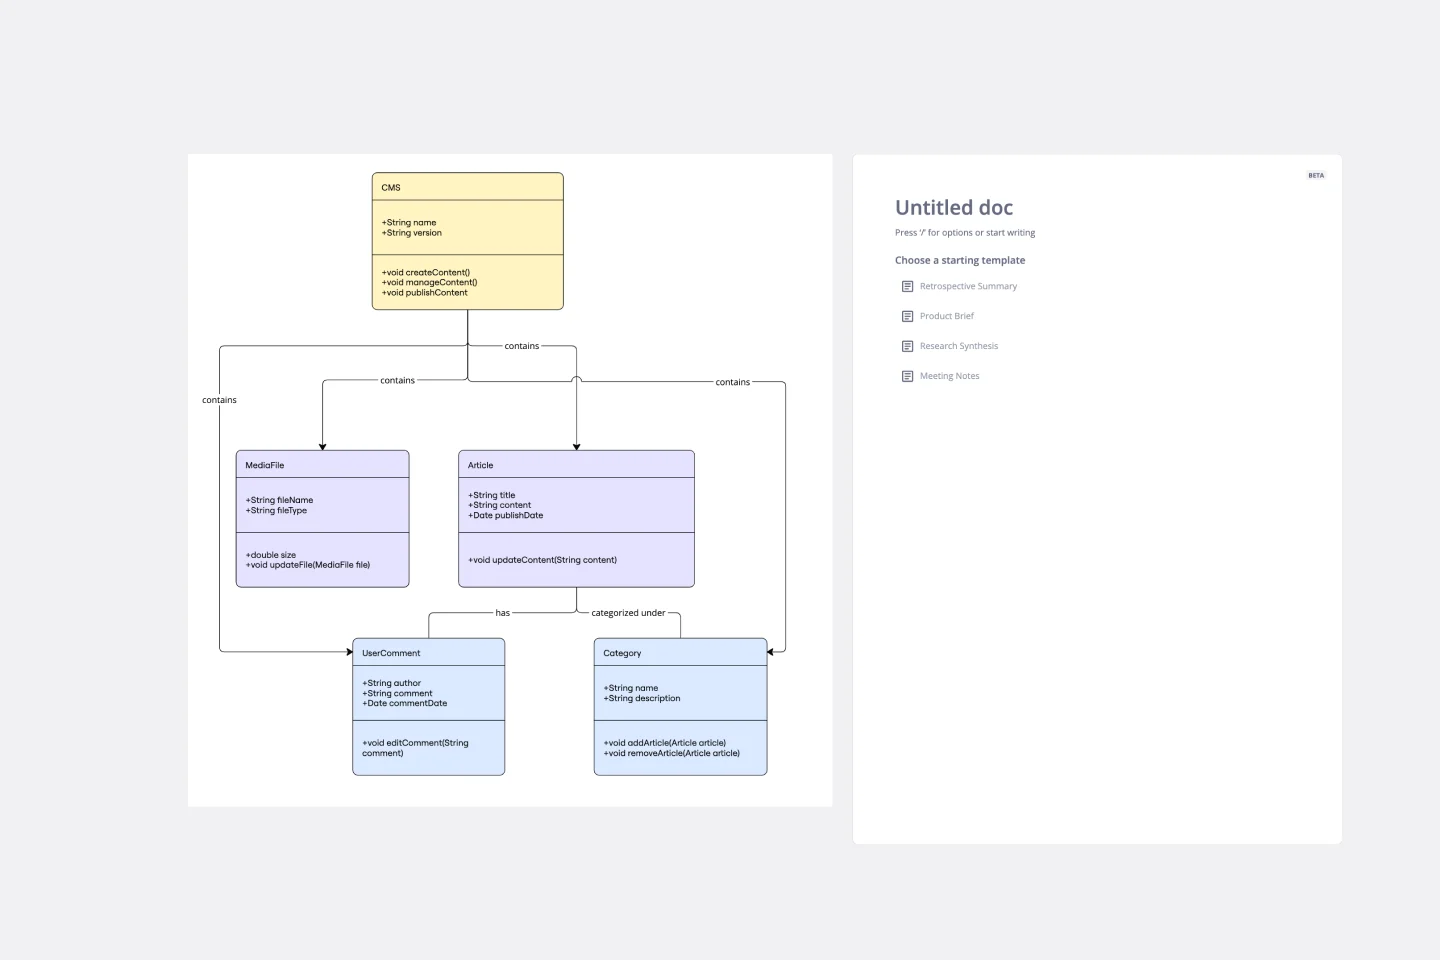
UML Class Content Management System (CMS) Template
Works best for:
UML
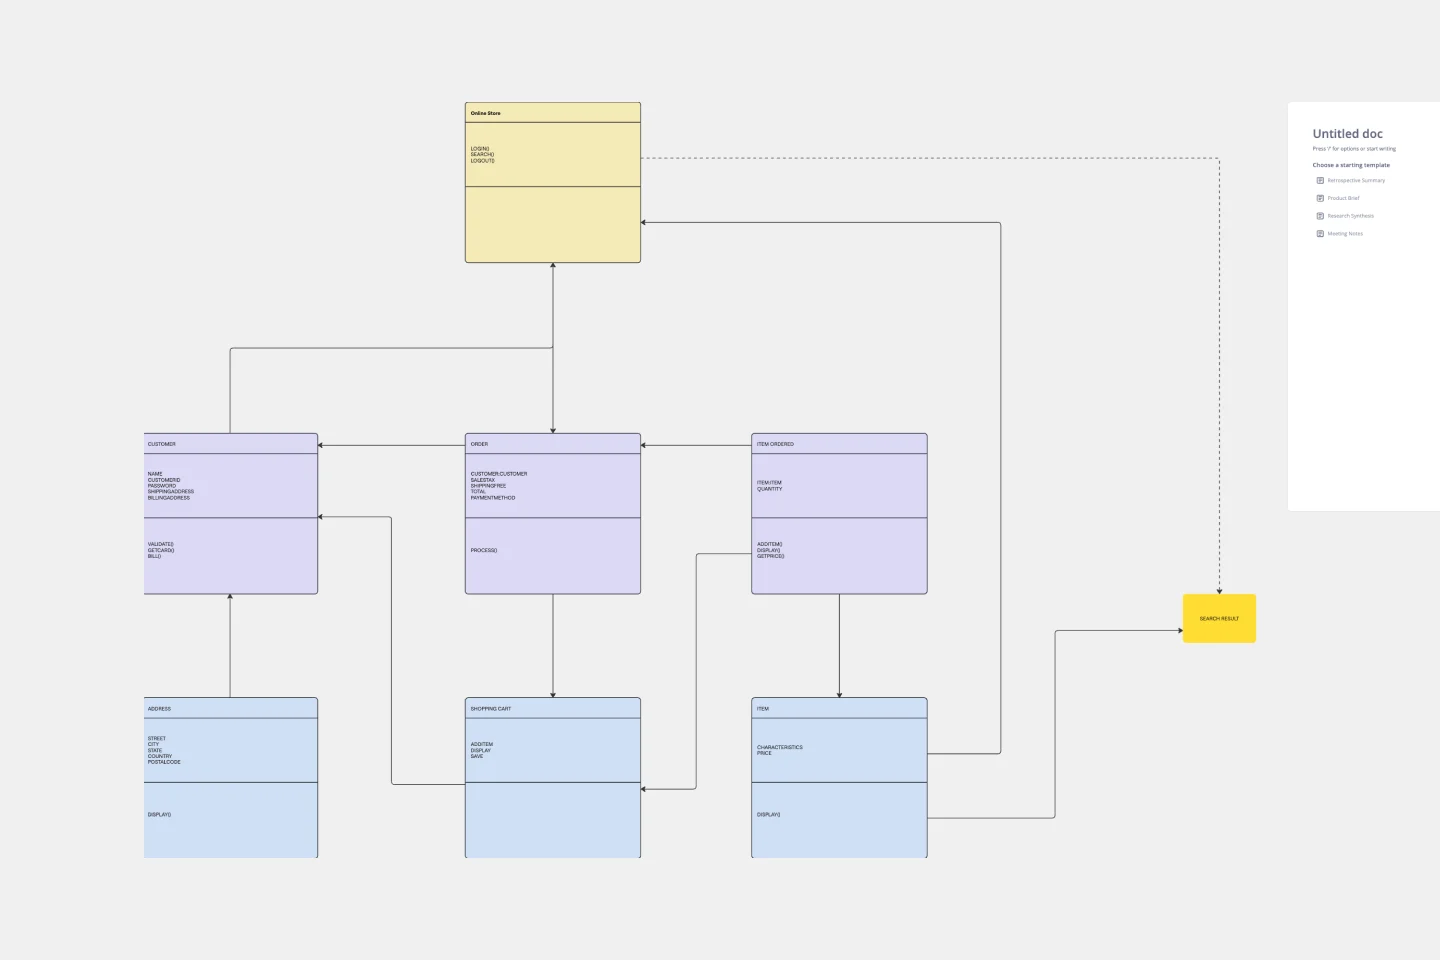
The UML Class Content Management System CMS Template simplifies documenting and designing the architecture of a Content Management System. It allows for the creation of UML class diagrams to visualize the structure of a CMS. Teams can efficiently map out key classes and their interactions, such as how users create, manage, and publish digital content. The template's integration into Miro's collaborative platform allows for real-time teamwork, customization, and easy sharing of feedback. This streamlines the documentation process and is valuable for software development projects aiming to develop or refine a CMS.
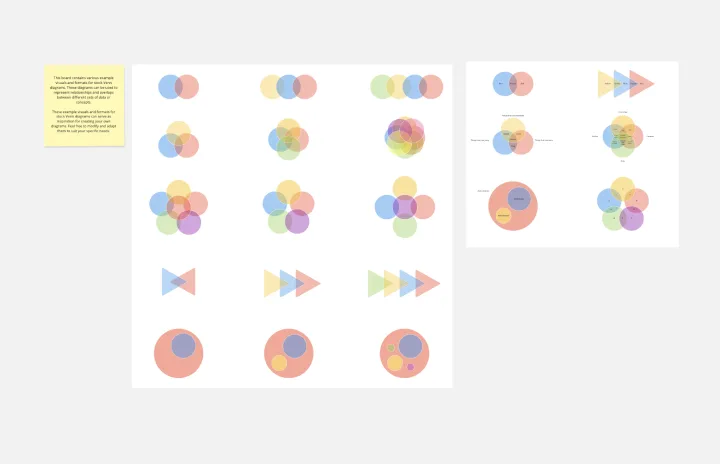
Venn Diagrams by Dave Westgarth
Works best for:
Venn Diagram
Visualize relationships and intersections clearly with the Collection Venn Diagram template. This tool is perfect for comparing multiple sets of data, identifying commonalities, and showcasing unique elements. Use it in presentations, research, and data analysis to make complex information more digestible. Ideal for educators, researchers, and analysts seeking to present data insights effectively.
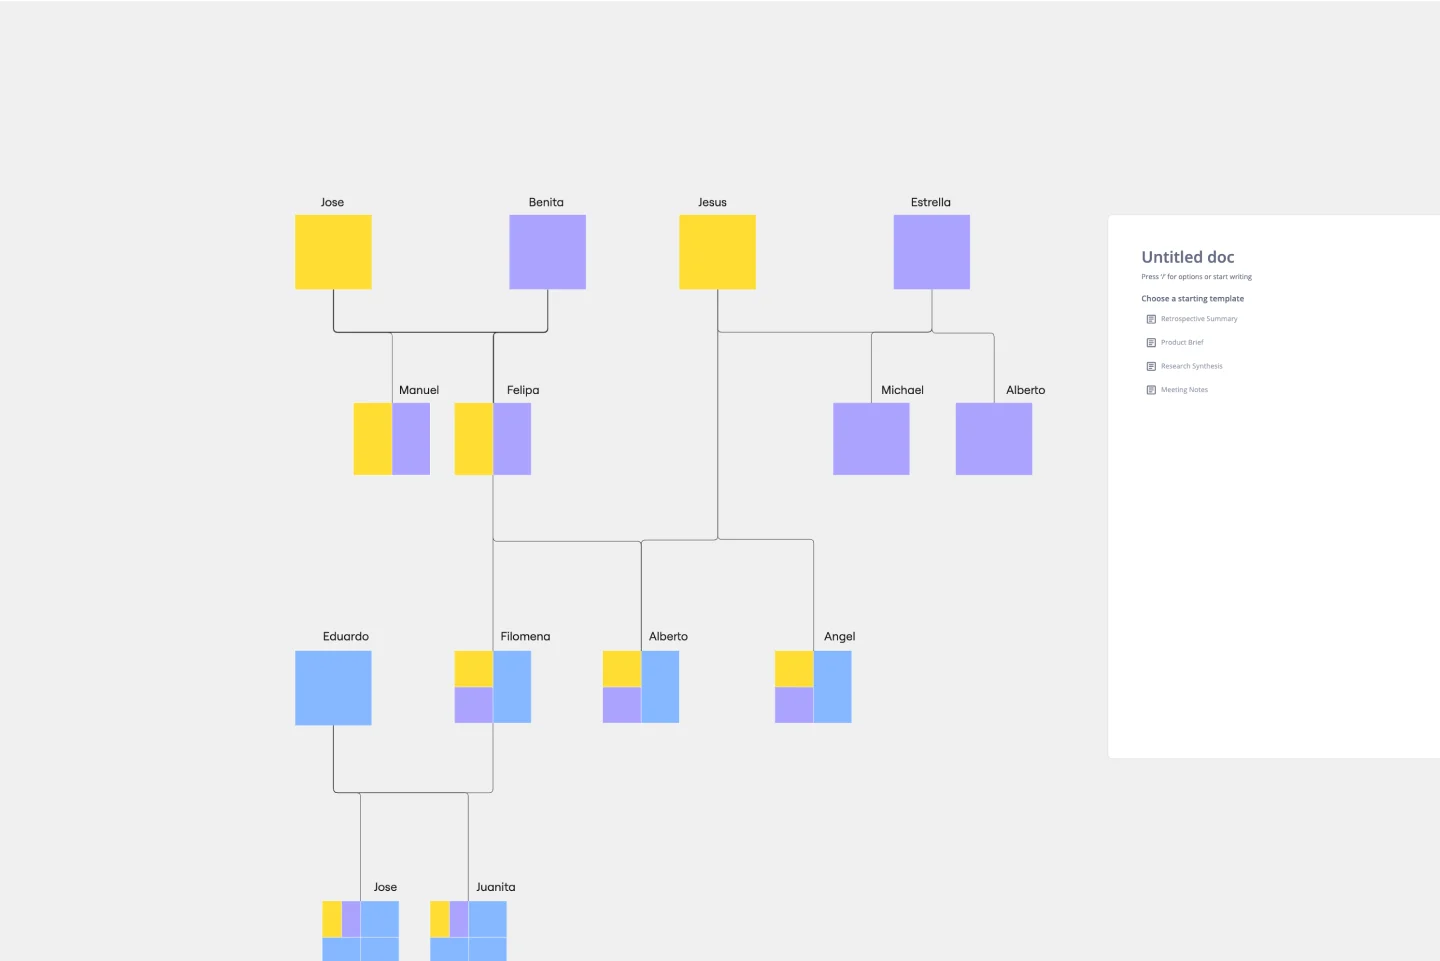
Genogram Template
Works best for:
Diagramming
The Genogram Template maps out family structures and relationships with exceptional depth and detail. Unlike traditional family trees, this template provides a comprehensive perspective by encapsulating familial connections, emotional ties, and significant life events. Create a genogram to unearth patterns and trends within a family, whether hereditary or environmental. Professionals across different domains can gain a holistic understanding of familial dynamics by showing deep insights into the nuances of relationships, facilitating better communication and problem-solving.