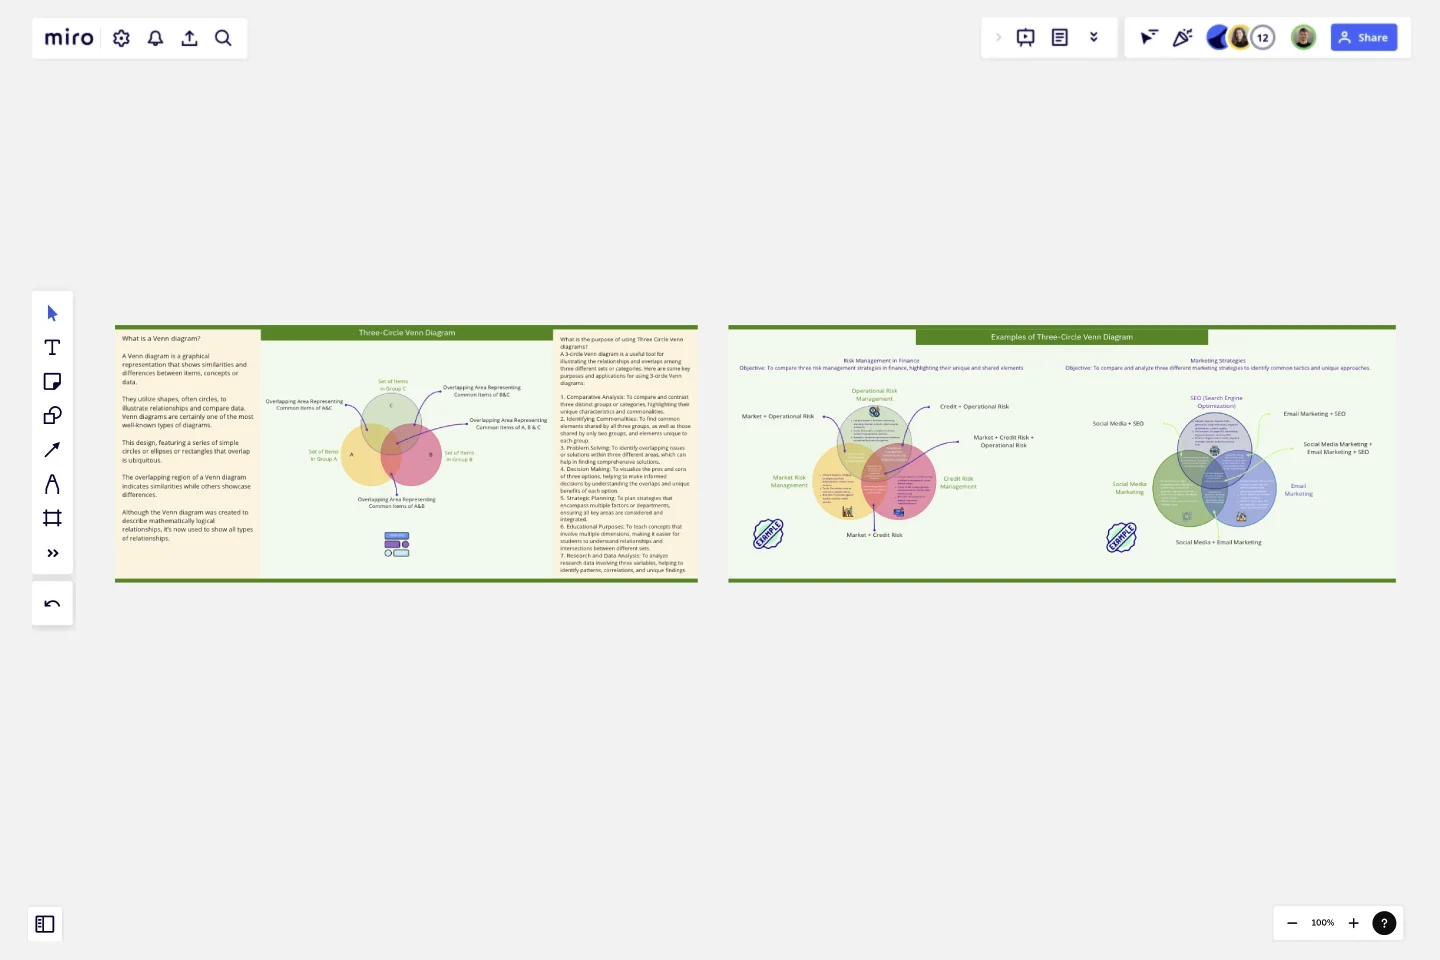
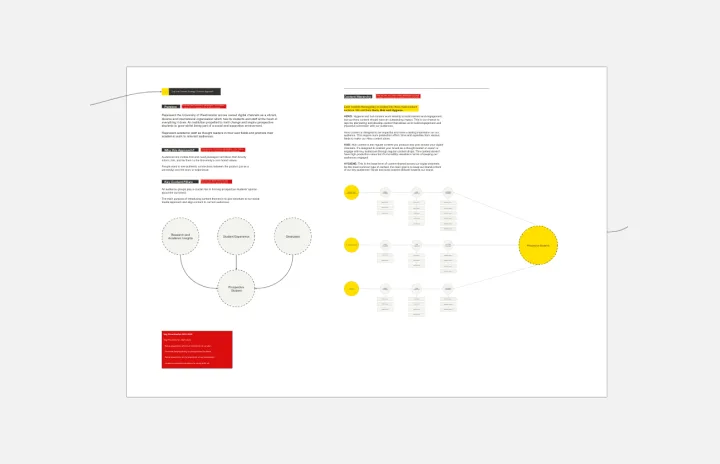
Three-Circle Venn Diagram
A Venn diagram is a graphical representation that shows similarities and differences between items, concepts or data.
They utilize shapes, often circles, to illustrate relationships and compare data.
Venn diagrams are certainly one of the most well-known types of diagrams. This design, featuring a series of simple circles or ellipses or rectangles that overlap is ubiquitous. The overlapping region of a Venn diagram indicates similarities while others showcase differences. Although the Venn diagram was created to describe mathematically logical relationships, it’s now used to show all types of relationships.
Purpose of using Three Circle Venn diagrams
A 3-circle Venn diagram is a useful tool for illustrating the relationships and overlaps among three different sets or categories. Here are some key purposes and applications for using 3-circle Venn diagrams:
1. Comparative Analysis: To compare and contrast three distinct groups or categories, highlighting their unique characteristics and commonalities.
2. Identifying Commonalities: To find common elements shared by all three groups, as well as those shared by only two groups, and elements unique to each group.
3. Problem Solving: To identify overlapping issues or solutions within three different areas, which can help in finding comprehensive solutions.
4. Decision Making: To visualize the pros and cons of three options, helping to make informed decisions by understanding the overlaps and unique benefits of each option.
5. Strategic Planning: To plan strategies that encompass multiple factors or departments, ensuring all key areas are considered and integrated.
6. Educational Purposes: To teach concepts that involve multiple dimensions, making it easier for students to understand relationships and intersections between different sets.
7. Research and Data Analysis: To analyze research data involving three variables, helping to identify patterns, correlations, and unique findings.
Along with step by step guide, two examples have also been provided to help you understand the concept of using 3-circle venn diagram. These can just be copy/paste to your own board.
This template was created by Khawaja Rizwan.
Get started with this template right now.
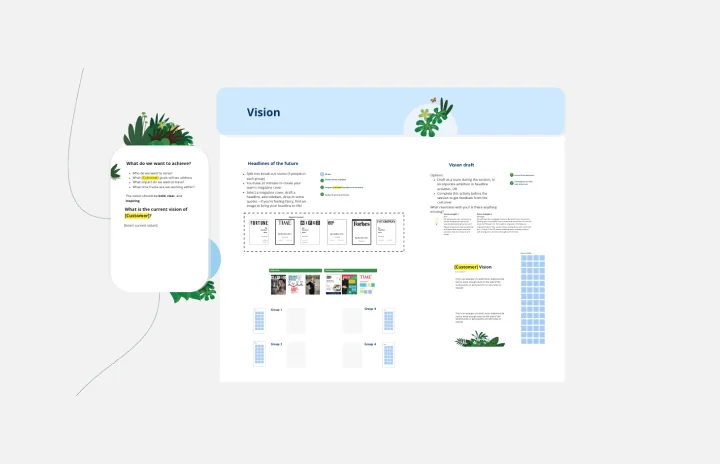
V2MOM Salesforce Template
Works best for:
Meetings, Strategic Planning
Align goals and strategies across your organization with the Salesforce V2MOM Template. Bring everyone together towards the same goals.
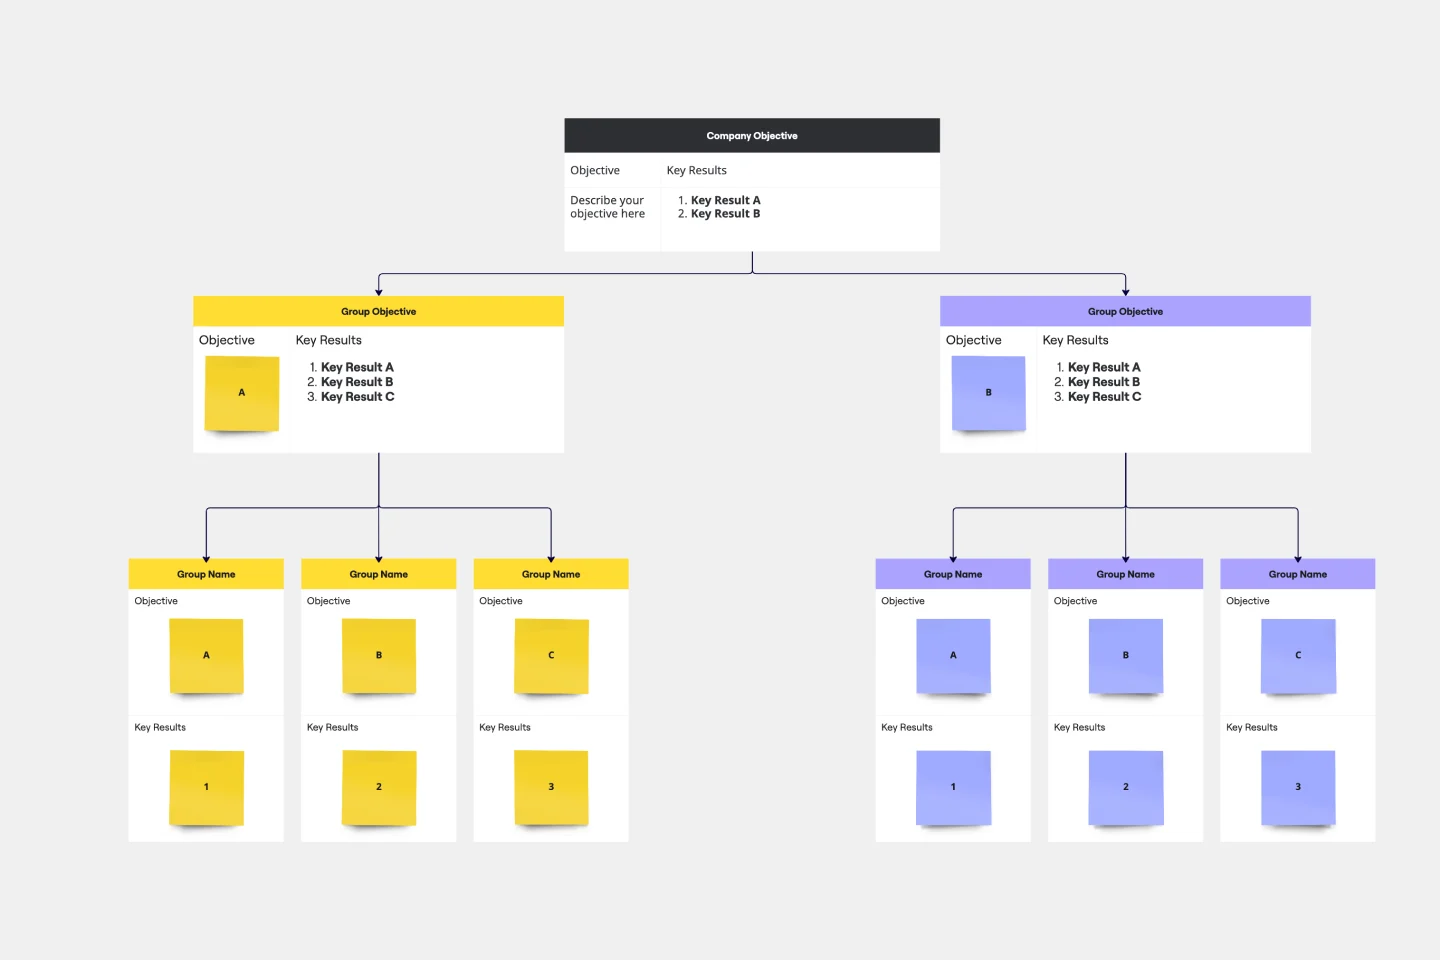
Objectives and Key Results (OKRs) Template
Works best for:
Leadership, Strategic Planning, Project Planning
Clarity, focus, and structure — those are the key ingredients to feeling confident in your company’s directions and decisions, and an OKR framework is designed to give them to you. Working on two main levels — strategic and operational — OKRs (short for objectives and key results) help an organization’s leaders determine the strategic objectives and define quarterly key results, which are then connected to initiatives. That’s how OKRs empower teams to focus on solving the most pressing organizational problems they face.
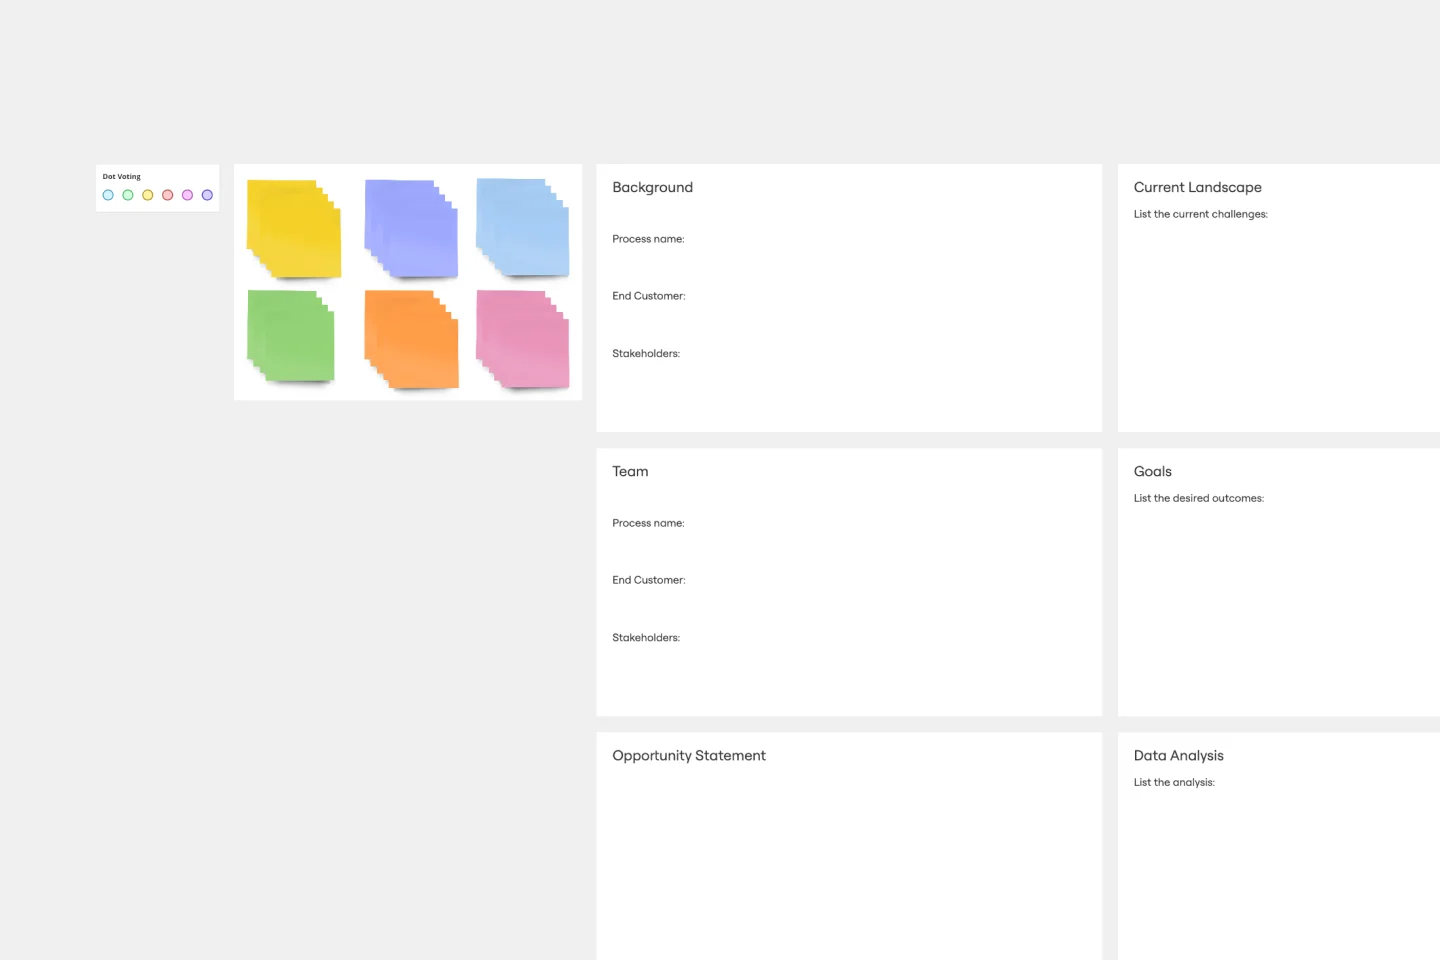
A3 Report Template
Works best for:
Product, Strategy and Planning
The A3 report template is a carefully designed tool that provides teams with a structured and visual methodology to tackle challenges. It divides the problem-solving process into background, current context, data analysis, and implementation plans, ensuring a comprehensive approach to each issue. One of the major advantages of this template is its "Data Analysis" section, which enables teams to delve deeply into concrete insights and trends. This data-driven approach ensures that all recommendations and actions are based on real, tangible evidence rather than just intuition, leading to more effective and strategic decision-making.
Content Strategy Template
Works best for:
Strategic Planning
Bring consistency across communication channels and develop killer content strategies with this Content Strategy Template. Designed to plan and deliver high-impact content, use this tool to collaborate faster and better.
Timeline Meeting
Works best for:
Timeline, Planning
The Timeline Meeting template is tailored for planning and conducting meetings with a focus on time management. It helps you set clear agendas, allocate time for each topic, and keep track of discussion points. This template ensures your meetings are productive and stay on track.
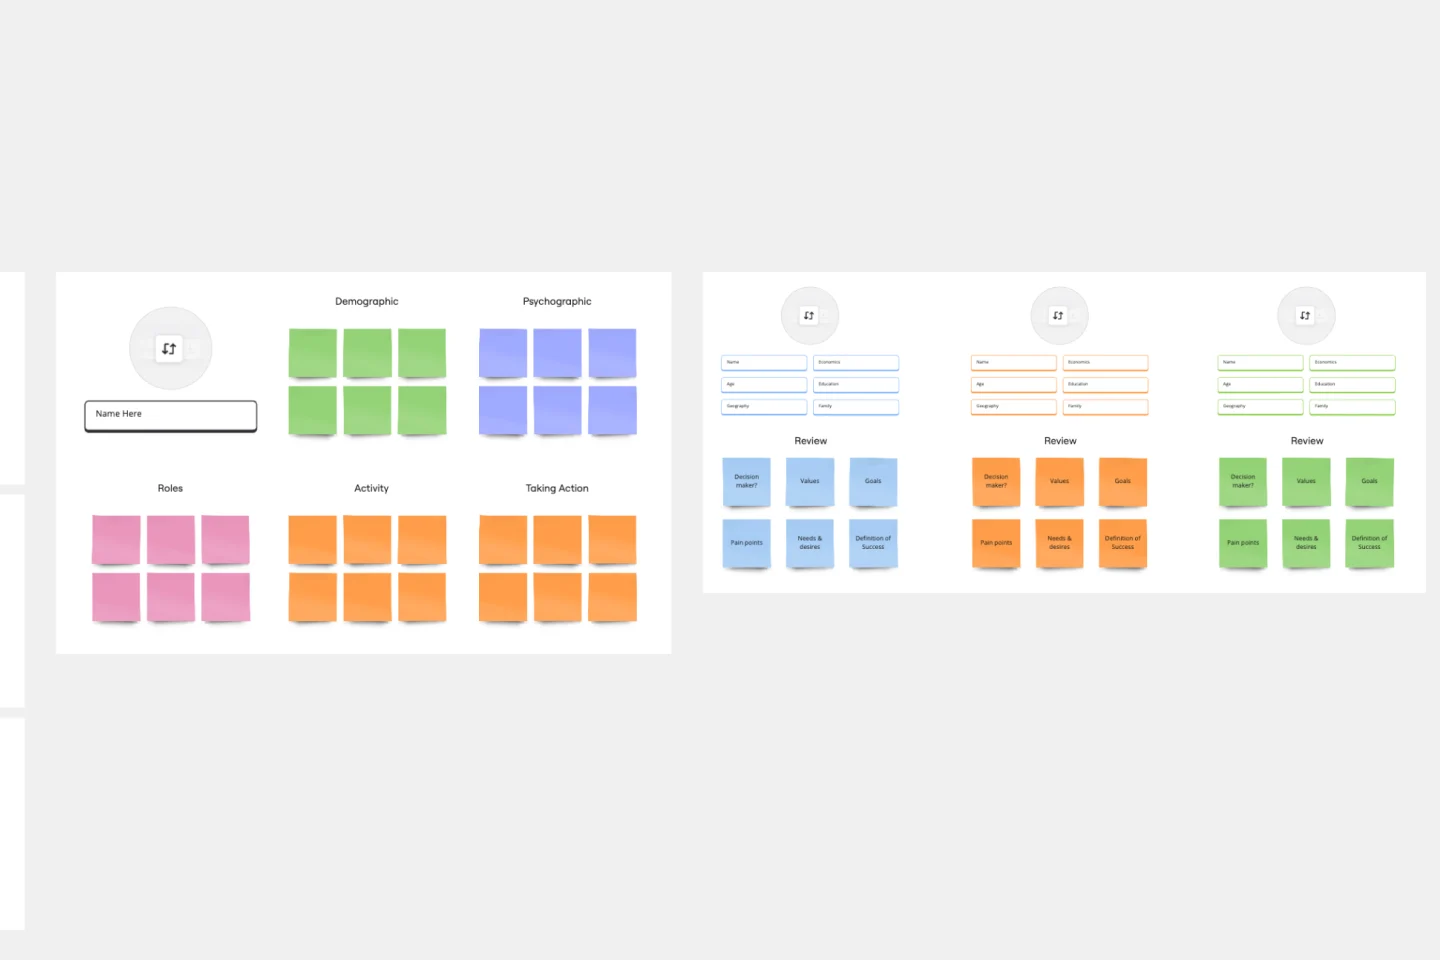
Target Audience Template
Works best for:
Marketing, Desk Research, Prioritization
Understanding your target audience is vital to business success. How can you market yourself effectively if you don’t know who you’re targeting? Using the Target Audience template, you can review valuable data about who your customers are and what they want from your product or service.