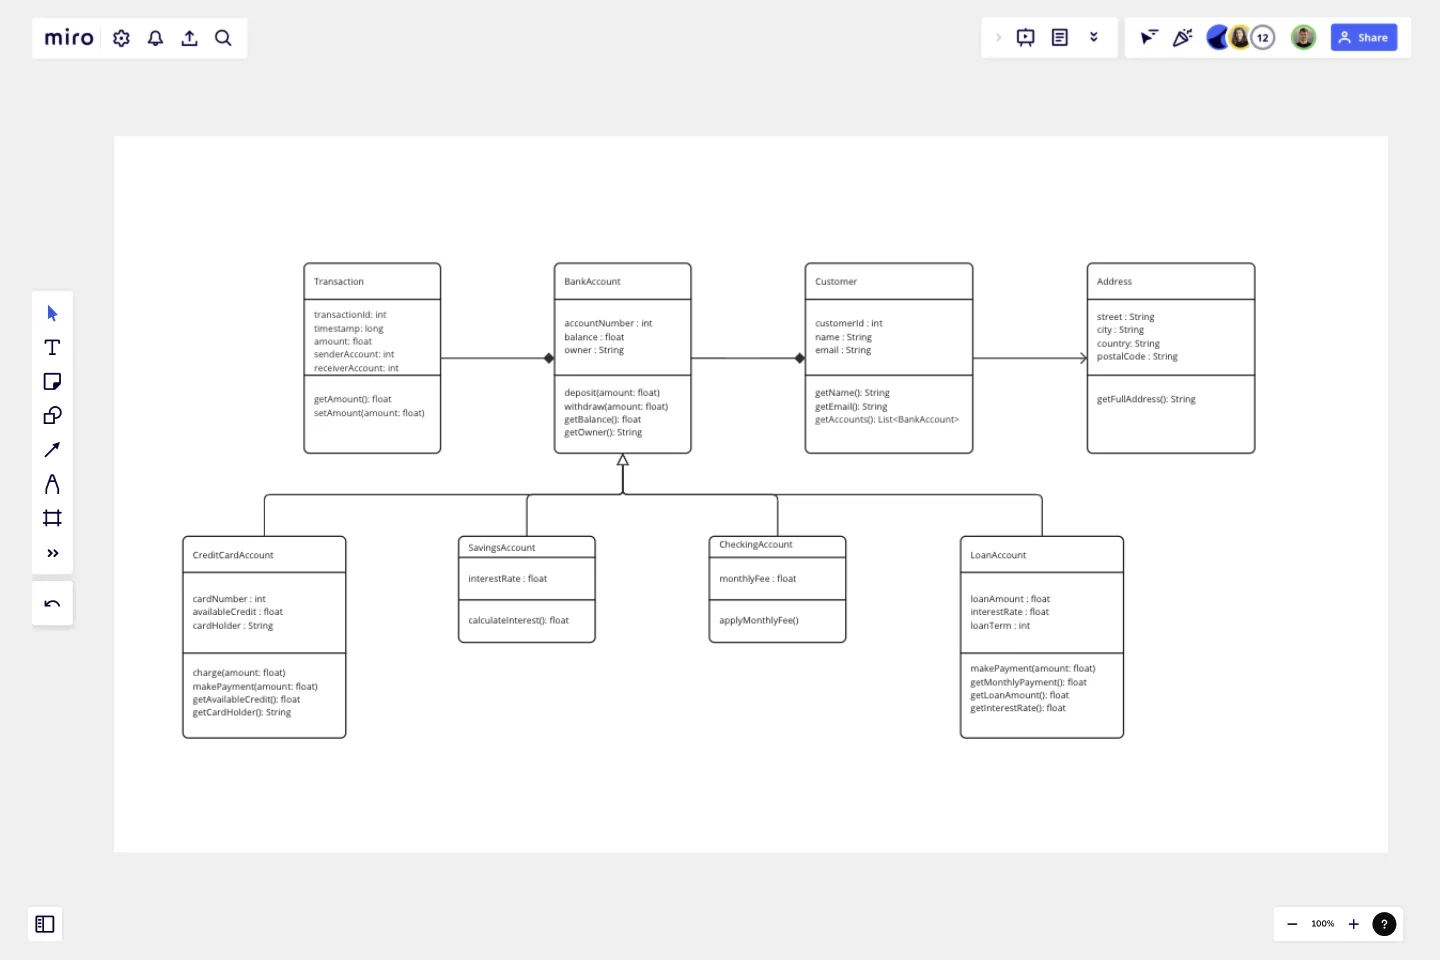
UML Class Diagram by Dmitry Ermakov
A UML (Unified Modeling Language) Class diagram is a visual representation that shows the structure and relationships of classes in a system or software application.
It provides an overview of the objects or entities in the system, their attributes (data), and their relationships with other classes.
In simple terms, you can think of a UML Class diagram as a blueprint or a map that helps you understand how different parts of a system or program are connected. It shows the building blocks of the system (classes) and how they interact with each other.
What to pay attention to
In a Class diagram, each class is represented as a box with three sections:
The top section contains the class name.
The middle section lists the attributes or properties of the class.
The bottom section shows the methods or behaviors that the class can perform.
The relationships between classes are represented by lines connecting the boxes. These relationships can include associations (connections between classes), generalization or inheritance (when one class inherits from another), aggregation or composition (when one class contains or is composed of another), and more.
Who this template is for
Overall, a UML Class diagram helps developers, designers, and stakeholders visualize and understand the structure of a system, the interactions between classes, and the behavior of objects within the system. It serves as a powerful communication tool for discussing, designing, and documenting software systems.
How to use a template
Use a template by adding it to a new or an exiting Miro board, and follow the intsructions on the board.
This template was created by Dmitry Ermakov.
Get started with this template right now.
ERD Educational Learning Management System Template
Works best for:
ERD
The ERD Educational Learning Management System Template is designed to streamline the management and organization of educational systems, particularly useful for institutions adapting to online and hybrid learning environments. It helps in efficiently planning and implementing Learning Management System (LMS) features by identifying key entities such as Students, Courses, Instructors, Assignments, and Grades, and the relationships between them.
Bracket Template
Works best for:
Diagramming
The Bracket Template is a dynamic visualization tool that helps to organize and rank ideas, entities, or teams in a sequential and competitive manner. It is structured like a tree, starting with multiple entries on either side, which then face off in successive rounds, leading to a single winner or conclusion. One of its standout benefits is its ability to simplify complex decision-making processes. Breaking down choices into smaller, head-to-head comparisons, makes the path to a final decision clearer, ensuring clarity and fostering engagement among participants. Moreover, the Bracket Template is particularly useful when there are multiple options to consider and when there is a need to compare and contrast those options. It is an effective way to streamline decision-making, making it easier and more efficient.
Crowd Sourced Cause and Effect
Works best for:
Fishbone Diagram, Problem solving
The Crowd Sourced Cause and Effect template leverages collective intelligence to identify root causes of problems. By involving multiple team members, you can gather diverse perspectives and uncover insights that might be overlooked. This collaborative approach ensures a comprehensive analysis and fosters team engagement.
Person Api Uml
Works best for:
Diagramming
The Person Api Uml template offers a visual framework for designing and modeling Person API structures and interactions. It provides elements for defining entities, attributes, and relationships within a Person API system. This template enables teams to visualize and communicate the structure and behavior of Person APIs, facilitating collaboration and alignment among stakeholders. By promoting clarity and consistency in API design, the Person Api Uml template empowers teams to build robust and interoperable Person API solutions.
Job Search Process Diagram
Works best for:
Diagramming
The Job Search Process Diagram template offers a visual tool for mapping out the steps and stages involved in the job search process. It provides a structured framework for organizing tasks, tracking progress, and managing resources. This template enables job seekers to streamline their job search efforts, stay organized, and increase their chances of success. By promoting clarity and efficiency, the Job Search Process Diagram empowers individuals to navigate the job market effectively and achieve their career goals.
