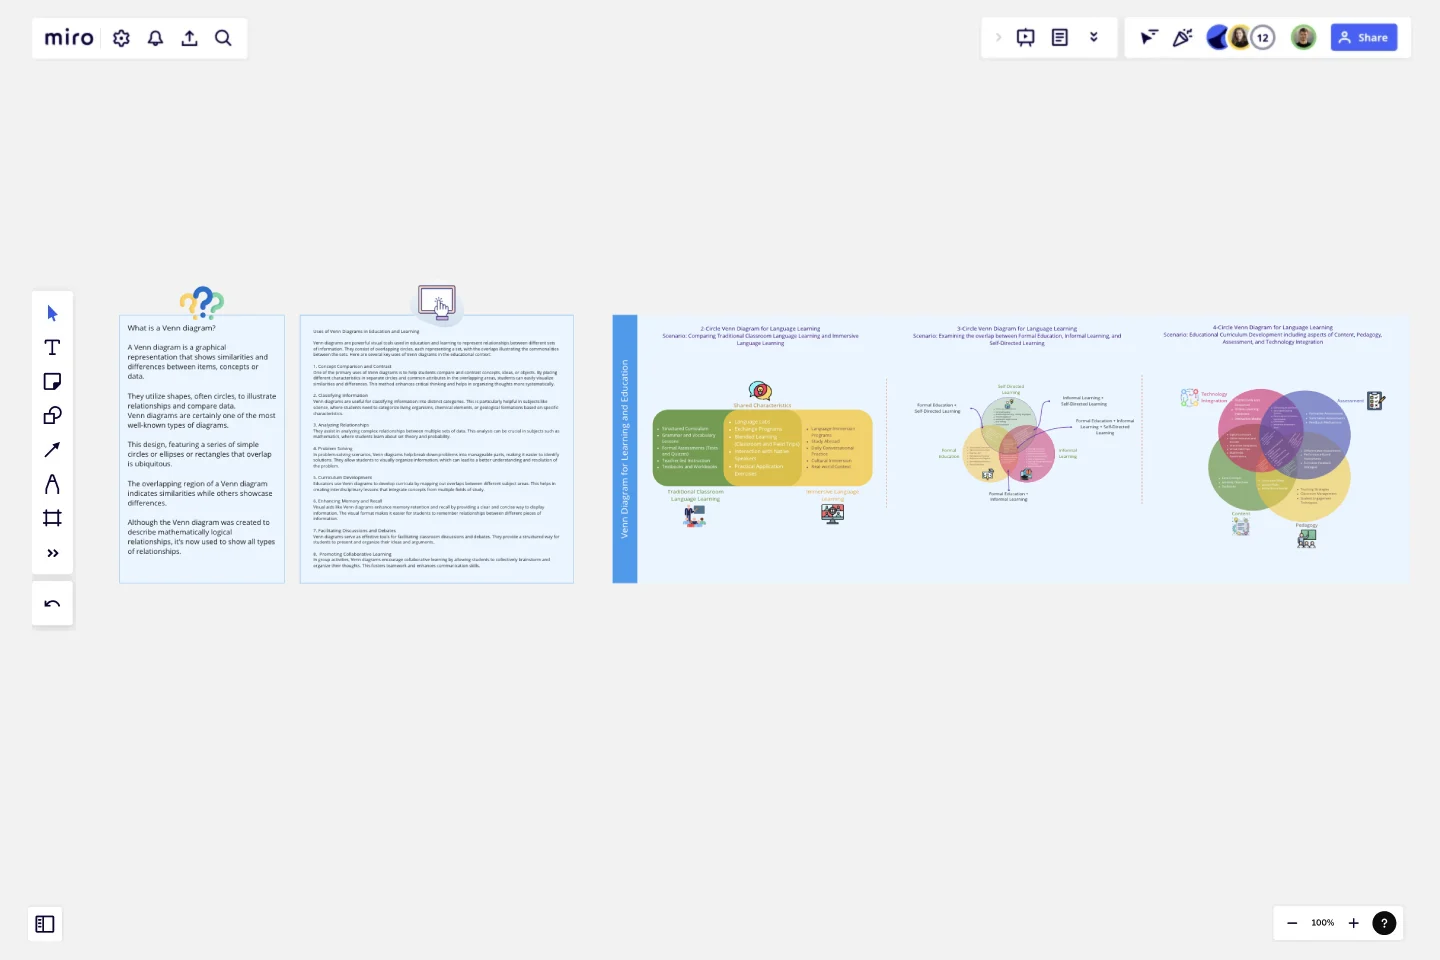
Venn Diagram for Learning and Education
A Venn diagram is a graphical representation that shows similarities and differences between items, concepts or data.
They utilize shapes, often circles, to illustrate relationships and compare data.
Venn diagrams are certainly one of the most well-known types of diagrams. This design, featuring a series of simple circles or ellipses or rectangles that overlap is ubiquitous. The overlapping region of a Venn diagram indicates similarities while others showcase differences. Although the Venn diagram was created to describe mathematically logical relationships, it’s now used to show all types of relationships.
Uses of Venn Diagrams in Education and Learning
Venn diagrams are powerful visual tools used in education and learning to represent relationships between different sets of information. They consist of overlapping circles, each representing a set, with the overlaps illustrating the commonalities between the sets. Here are several key uses of Venn diagrams in the educational context:
1. Concept Comparison and Contrast
One of the primary uses of Venn diagrams is to help students compare and contrast concepts, ideas, or objects. By placing different characteristics in separate circles and common attributes in the overlapping areas, students can easily visualize similarities and differences. This method enhances critical thinking and helps in organizing thoughts more systematically.
2. Classifying Information
Venn diagrams are useful for classifying information into distinct categories. This is particularly helpful in subjects like science, where students need to categorize living organisms, chemical elements, or geological formations based on specific characteristics.
3. Analyzing Relationships
They assist in analyzing complex relationships between multiple sets of data. This analysis can be crucial in subjects such as mathematics, where students learn about set theory and probability.
4. Problem Solving
In problem-solving scenarios, Venn diagrams help break down problems into manageable parts, making it easier to identify solutions. They allow students to visually organize information, which can lead to a better understanding and resolution of the problem.
5. Curriculum Development
Educators use Venn diagrams to develop curricula by mapping out overlaps between different subject areas. This helps in creating interdisciplinary lessons that integrate concepts from multiple fields of study.
6. Enhancing Memory and Recall
Visual aids like Venn diagrams enhance memory retention and recall by providing a clear and concise way to display information. The visual format makes it easier for students to remember relationships between different pieces of information.
7. Facilitating Discussions and Debates
Venn diagrams serve as effective tools for facilitating classroom discussions and debates. They provide a structured way for students to present and organize their ideas and arguments.
8. Promoting Collaborative Learning
In group activities, Venn diagrams encourage collaborative learning by allowing students to collectively brainstorm and organize their thoughts. This fosters teamwork and enhances communication skills.Three examples from the above areas have been created to help you understand the application of the Venn diagram in the Education and Learning domain.
This template was created by Khawaja Rizwan.
Get started with this template right now.
Mental Model Template
Works best for:
Business Management, Mind Mapping, Diagrams
Smart solutions and strong, strategic decisions. The best organizations make both, and a mental model is designed to help them do it. We give you a fast and easy way to try it out — just fill out our ready-made, flexible template and add sticky notes, shapes, and arrows to create a powerful map.
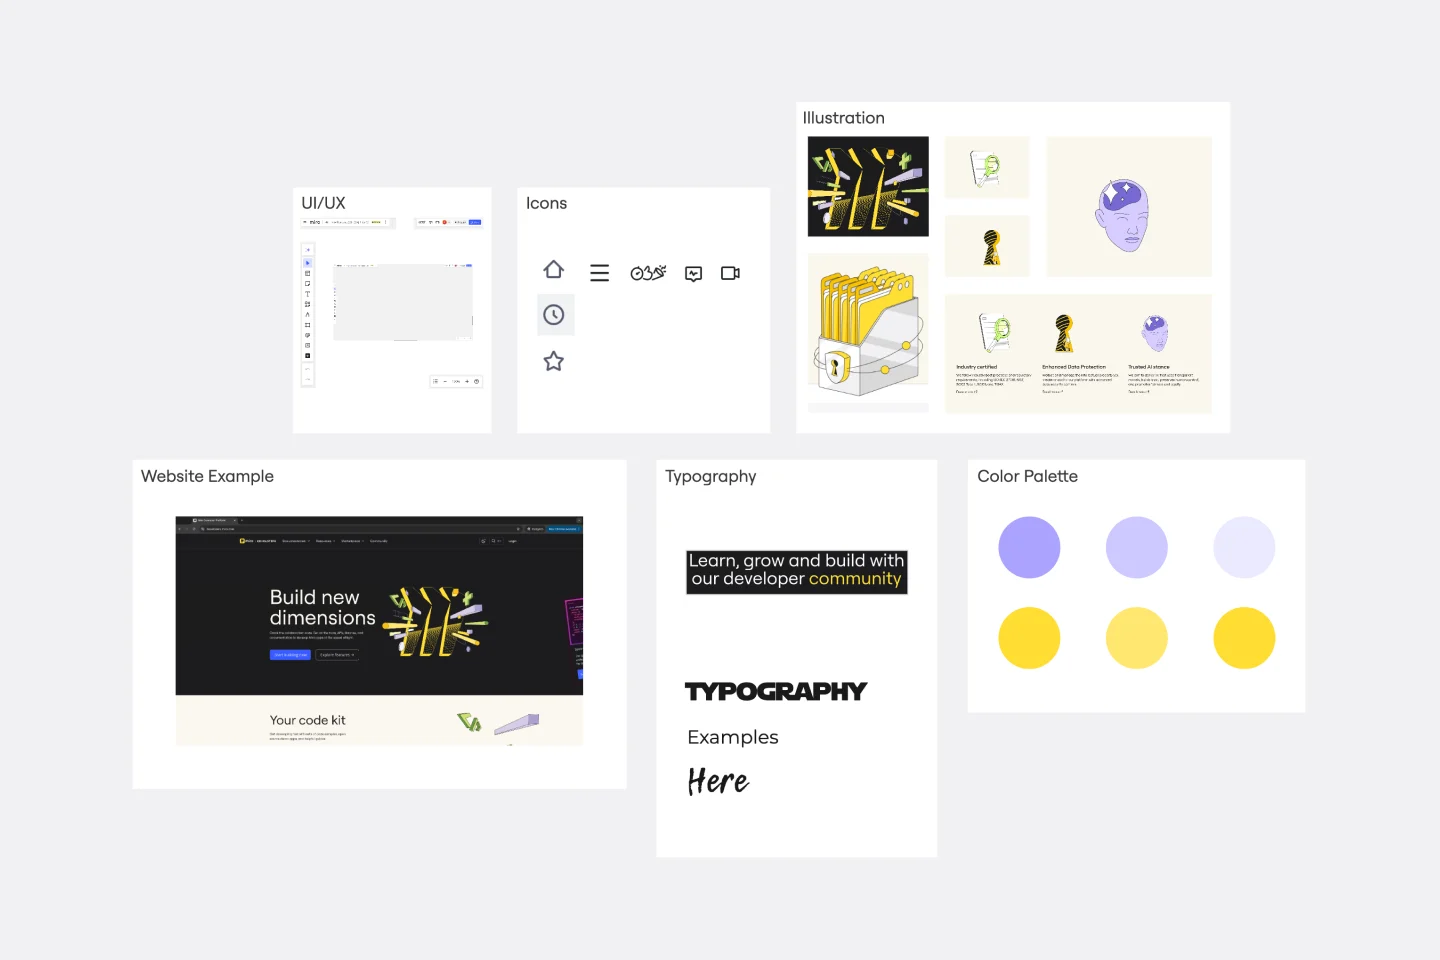
Mood Board Template
Works best for:
Design, Brainstorming, Ideation
When you’re kicking off a creative project, it’s sometimes important to communicate the mood you’re trying to evoke — but it’s so hard to do it with words. So create a mood board and use images, color palettes, textures, and typography. Mood boards are also perfect for gathering inspiration and sketching out and pitching ideas, and they’re not just for designers — your content writers, sales teams, and product teams can use them too, and this template makes it easy for all of you to get started.
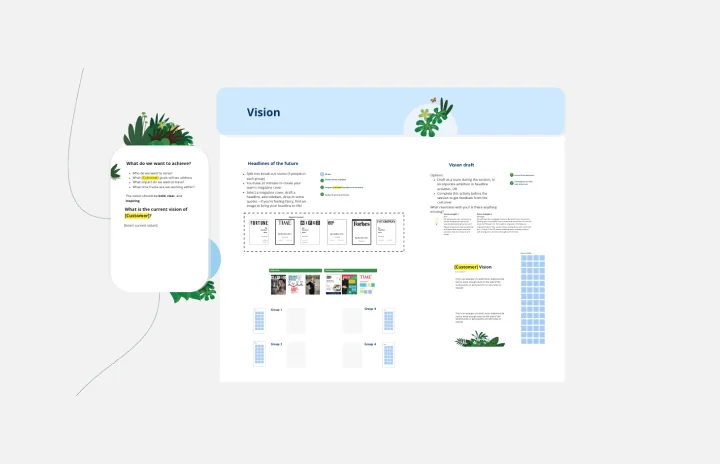
V2MOM Salesforce Template
Works best for:
Meetings, Strategic Planning
Align goals and strategies across your organization with the Salesforce V2MOM Template. Bring everyone together towards the same goals.
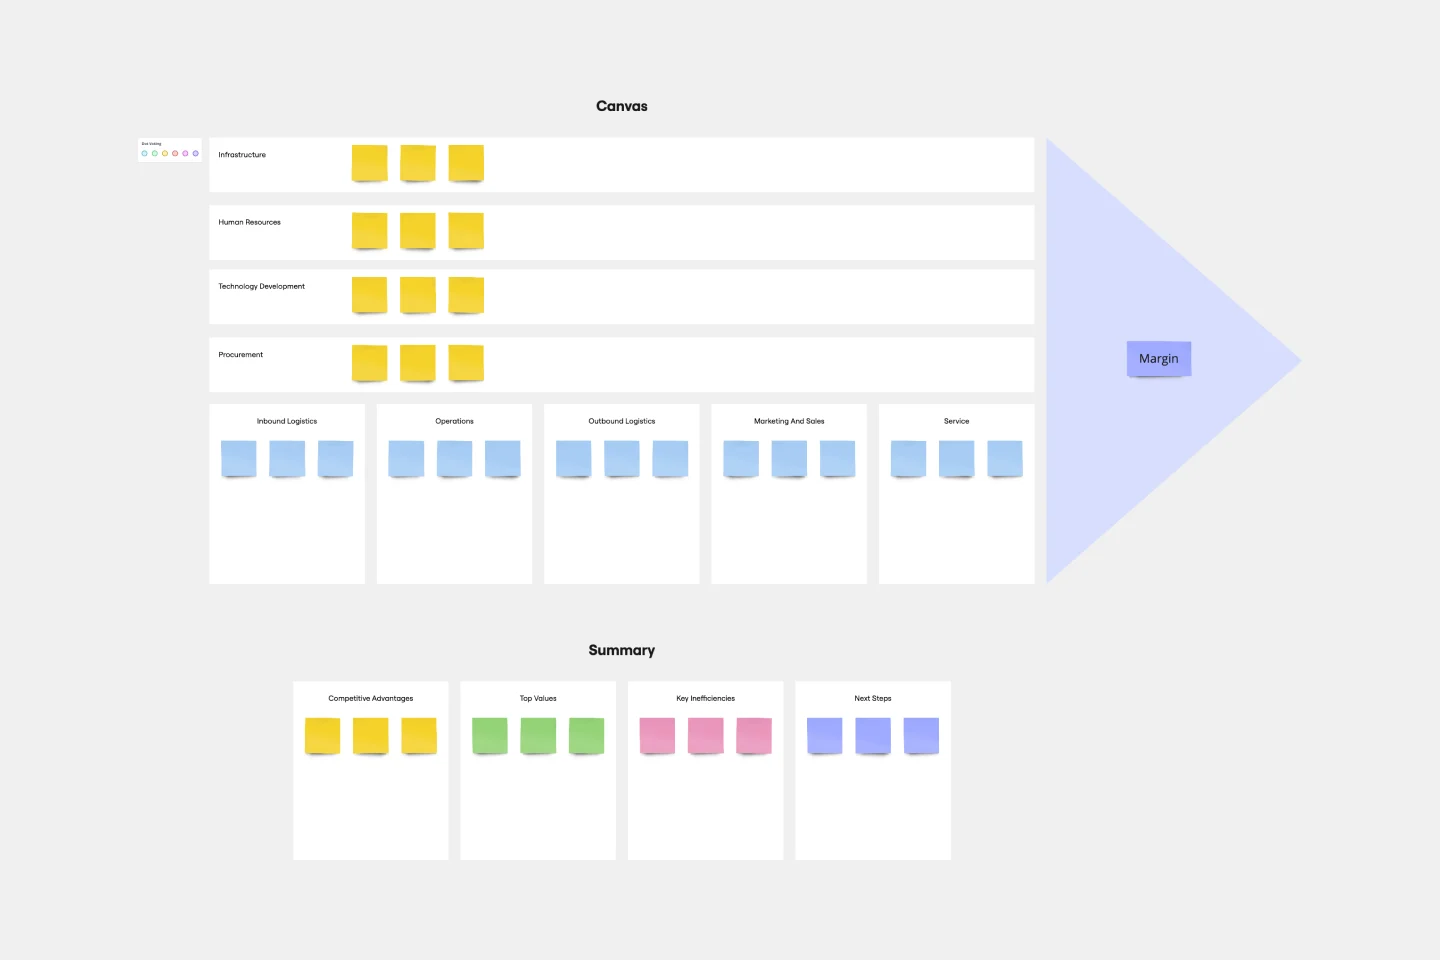
Value Chain Analysis Template
Works best for:
Leadership, Strategic Planning, Workflows
First coined by Harvard Business School professor Michael Porter, the value chain analysis helps your team evaluate your business activities so you can find ways to improve your competitive advantage. A value chain is a set of activities that a company performs in order to deliver a valuable product from start to finish. The analysis itself allows your team to visualize all the business activities involved in creating the product—and helps you identify inefficiencies, bottlenecks, and miscommunication within the process.
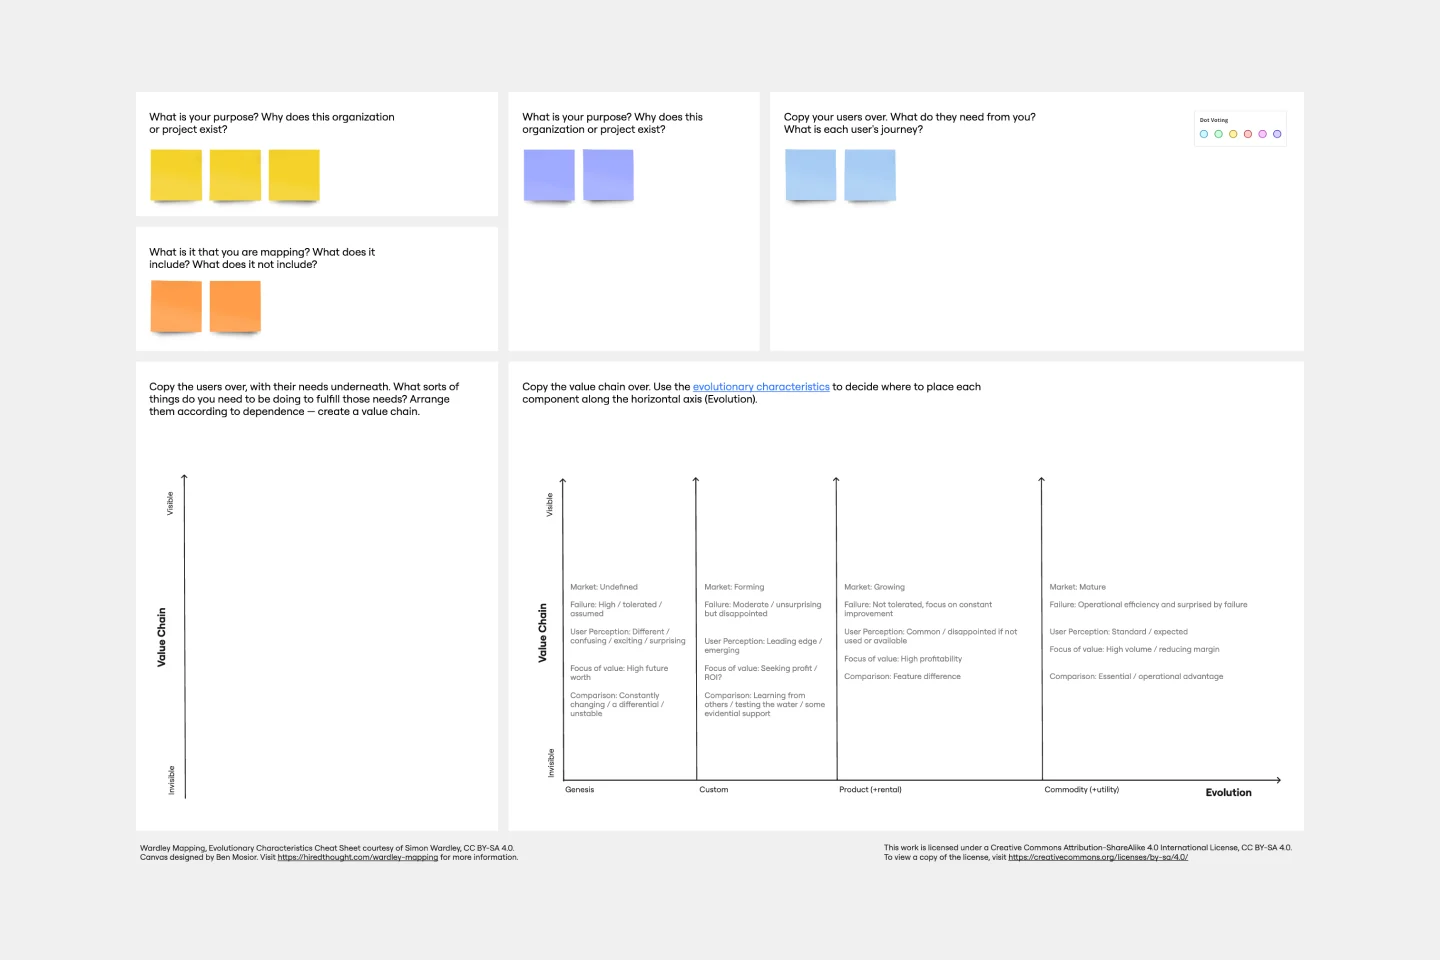
Wardley Mapping Canvas Template
Works best for:
Leadership, Strategic Planning, Mapping
A Wardley Map represents the landscape in which a business operates. It's made up of a value chain (the activities required to fulfill user needs) graphed against the evolution of individual activities over time. You place components with value on the y-axis and commodity on the x-axis. Use a Wardley Map to understand shared assumptions about your environment and discover what strategic options are available. Easily communicate your understanding of the landscape to your team, new hires, and stakeholders.
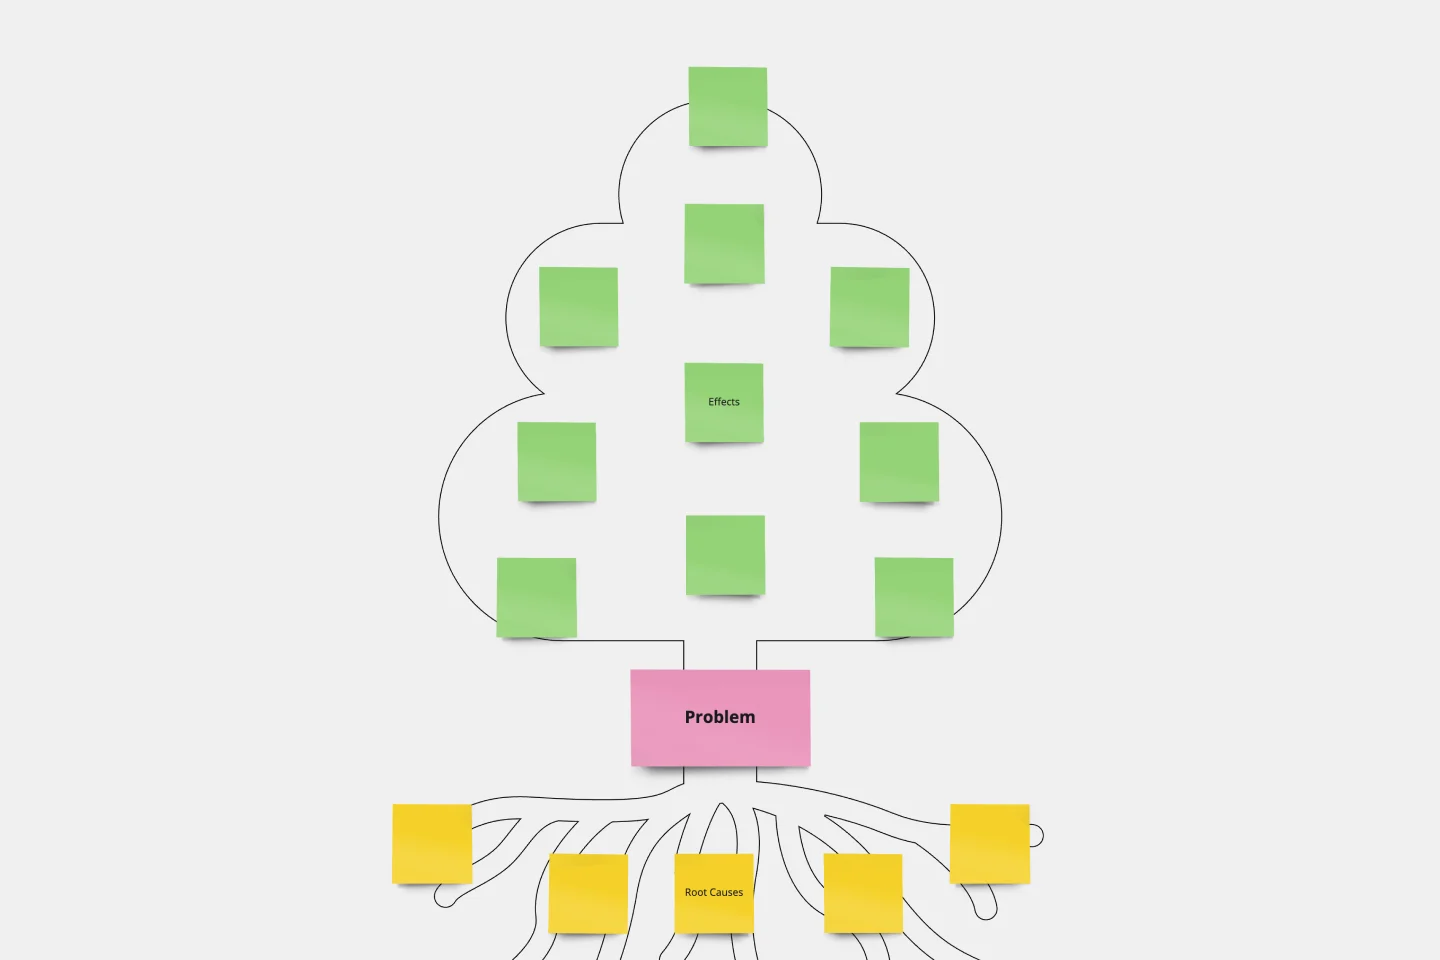
Problem Tree Template
Works best for:
Strategy & Planning
The Problem Tree Template is a visual tool crafted to examine a primary issue, its consequential effects, and its foundational causes. Picture it: The tree's trunk embodies the central dilemma, its branches display the direct ramifications, and the roots delve into the underlying reasons. By organizing a challenge in such an illustrative manner, users can comprehensively grasp their situation.