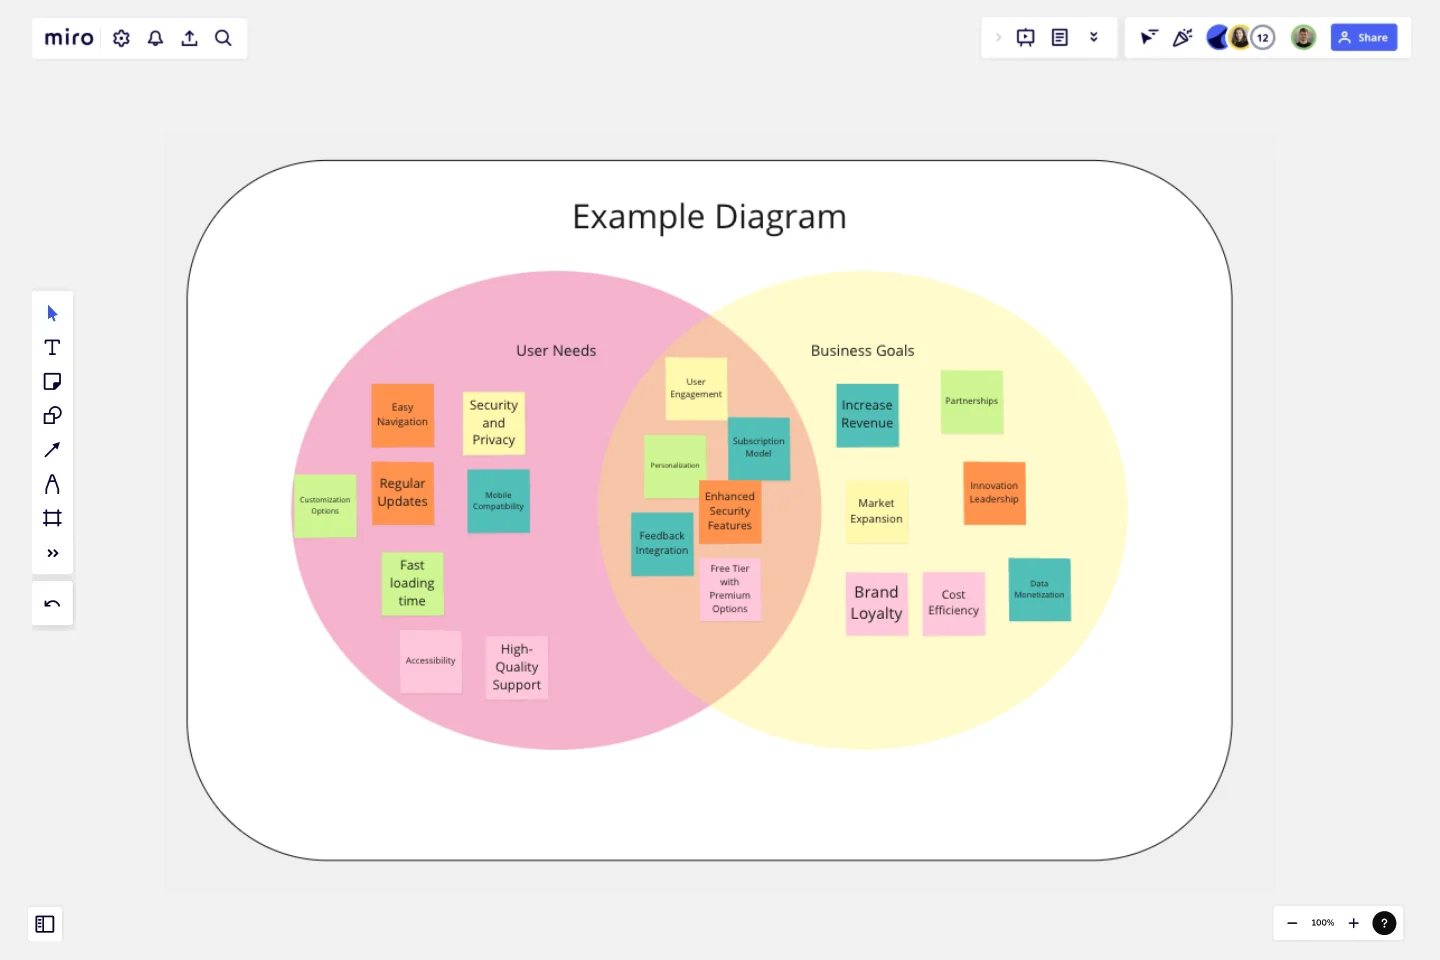
Venn Diagram for Product Development
The Venn Diagram for Product Development template is a powerful tool designed to help teams align user needs with business goals.
By visually mapping out these two critical areas and identifying their intersections, this template facilitates a clearer understanding of where efforts should be focused for maximum impact.
Why Use This Template?
Clarify Priorities:
Visual Clarity: The template provides a simple, clear layout to help teams visually differentiate and prioritize user needs and business goals.
Focus Areas: It highlights the sweet spot where user needs and business goals overlap, showing areas that offer the highest potential for successful product development.
Enhance Collaboration:
Team Alignment: Use this template in meetings to ensure all team members and stakeholders are on the same page.
Interactive Tool: Perfect for interactive sessions, allowing teams to collaboratively identify and discuss key priorities.
Drive Decision-Making:
Informed Choices: Helps teams make data-driven decisions by clearly showing which features and initiatives meet both user needs and business goals.
Strategic Planning: Ideal for planning product features, enhancements, and roadmaps with a balanced approach.
Ease of Use:
Pre-Labeled Sections: Comes with pre-labeled sections for "User Needs," "Business Goals," and the overlap area, making it easy to get started.
Editable Placeholders: Includes editable placeholders for quick note-taking and brainstorming.
Versatile Application:
Adaptable: Suitable for various stages of product development, from initial brainstorming to detailed planning.
Reusable: Can be reused for different products or iterations, making it a valuable tool for ongoing development processes.
Use Cases:
Product Brainstorming: Identify which features or enhancements to prioritize based on user feedback and business objectives.
Strategy Meetings: Align product strategy with overall business goals and customer demands.
Feature Planning: Plan and prioritize features that offer the best balance between user satisfaction and business success.
Team Workshops: Facilitate collaborative workshops to gather diverse perspectives and insights.
By using the Venn Diagram for Product Development template, teams can ensure a balanced and comprehensive approach to product planning, leading to more effective and successful outcomes.
This template was created by Anthony.
Get started with this template right now.
Bang for the Buck Template
Works best for:
Project Management, Strategic Planning, Prioritization
The name pretty much says it—this Agile framework is all about helping you maximize efficiency by powering collaboration between product managers and dev teams. Together you can go over each to-do on the project agenda and evaluate them in terms of costs and benefits. That way you can prioritize tasks based on how much bang for your buck they deliver. This template is great for teams and organizations that want to make a strategic plan to tackle an upcoming sprint.
The Working & Stuck Venn Diagram
Works best for:
Venn Diagrams
The Working Stuck Venn Diagram template helps you identify and resolve project blockages. Use it to compare tasks, resources, and challenges, pinpointing where work is getting stuck. This template facilitates problem-solving and strategic planning, helping teams overcome obstacles and improve workflow efficiency. Ideal for project managers, team leaders, and anyone looking to enhance productivity and ensure smooth project execution.
Sprint Planning by Piera Mattioli
Works best for:
Planning, Strategy
Sprint Planning Template helps you organize and plan your sprints effectively. It allows you to set goals, allocate tasks, and track progress, ensuring your team stays focused and meets sprint objectives. Perfect for agile teams.
Crazy Eights Template
Works best for:
Design Thinking, Brainstorming, Ideation
Sometimes you just need to get the team’s creative juices flowing for a brainstorm—and get them thinking of as many ideas as they can, as fast as they can. Crazy Eights will do it in a hurry. Favoring quantity over quality, this sketch brainstorming exercise challenges them to come up with eight ideas in eight minutes, which leaves no time to second guess ideas. It’s perfect for early stages of development, and it’s a team favorite for being fast paced and fun.
Sales Strategy Gantt Chart
Works best for:
Strategy, Planning
Creating and executing a sales strategy requires meticulous planning. The Sales Strategy Gantt Chart template helps you map out every step of your strategy, from goal setting to implementation and review. Visualize key activities, set timelines, and assign tasks to ensure your sales team stays focused and aligned. This template enables you to track progress, measure performance, and make data-driven adjustments for better sales outcomes.
Venn Diagram Practical Applications
Works best for:
Venn Diagram
The Venn Diagram for Practical Applications template helps you apply Venn diagrams to real-world scenarios. Use this template to solve problems, identify relationships, and make decisions based on clear visual analysis. It's perfect for practical tasks such as project planning, resource allocation, and strategic decision-making. This tool is ideal for business professionals, educators, and anyone looking to apply theoretical concepts to practical situations.
