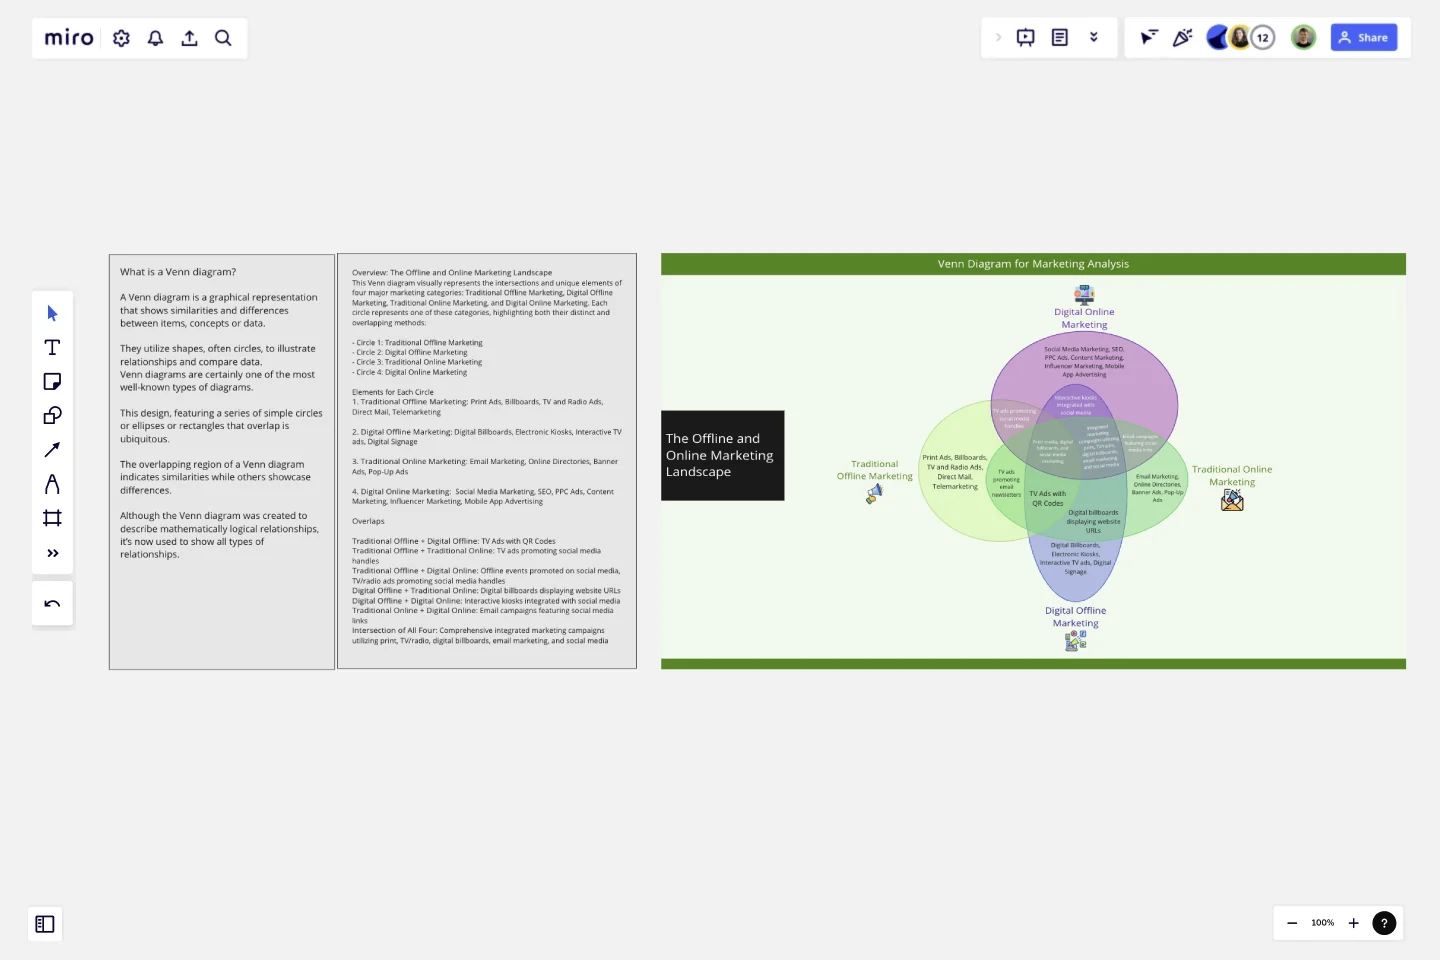
Venn Diagram for Marketing Analysis
A Venn diagram is a graphical representation that shows similarities and differences between items, concepts or data.
They utilize shapes, often circles, to illustrate relationships and compare data. Venn diagrams are certainly one of the most well-known types of diagrams. This design, featuring a series of simple circles or ellipses or rectangles that overlap is ubiquitous. The overlapping region of a Venn diagram indicates similarities while others showcase differences. Although the Venn diagram was created to describe mathematically logical relationships, it’s now used to show all types of relationships.
Overview: The Offline and Online Marketing Landscape
This Venn diagram visually represents the intersections and unique elements of four major marketing categories: Traditional Offline Marketing, Digital Offline Marketing, Traditional Online Marketing, and Digital Online Marketing. Each circle represents one of these categories, highlighting both their distinct and overlapping methods:
- Circle 1: Traditional Offline Marketing
- Circle 2: Digital Offline Marketing
- Circle 3: Traditional Online Marketing
- Circle 4: Digital Online MarketingElements for Each Circle
1. Traditional Offline Marketing: Print Ads, Billboards, TV and Radio Ads, Direct Mail, Telemarketing
2. Digital Offline Marketing: Digital Billboards, Electronic Kiosks, Interactive TV ads, Digital Signage
3. Traditional Online Marketing: Email Marketing, Online Directories, Banner Ads, Pop-Up Ads
4. Digital Online Marketing: Social Media Marketing, SEO, PPC Ads, Content Marketing, Influencer Marketing, Mobile App Advertising
Overlaps
Traditional Offline + Digital Offline: TV Ads with QR Codes
Traditional Offline + Traditional Online: TV ads promoting social media handles
Traditional Offline + Digital Online: Offline events promoted on social media, TV/radio ads promoting social media handles
Digital Offline + Traditional Online: Digital billboards displaying website URLs
Digital Offline + Digital Online: Interactive kiosks integrated with social media
Traditional Online + Digital Online: Email campaigns featuring social media links
Intersection of All Four: Comprehensive integrated marketing campaigns utilizing print, TV/radio, digital billboards, email marketing, and social media.
Above elaborated marketing analysis venn-diagram will help you understand its application to your problem statement.
This template was created by Khawaja Rizwan.
Get started with this template right now.
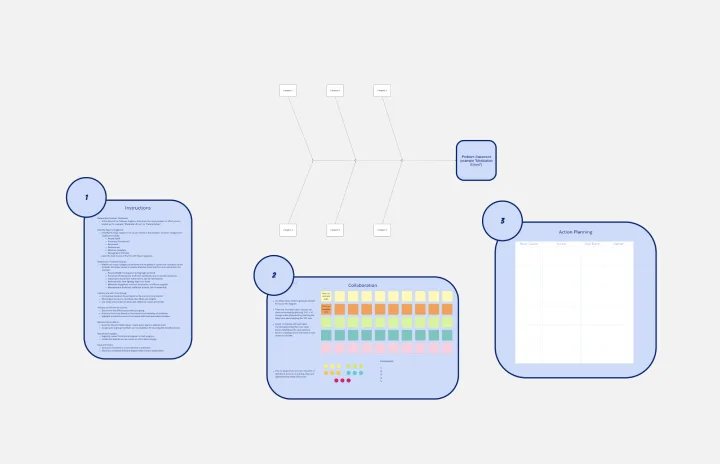
Fishbone Diagram for Healthcare
Works best for:
Fishbone Diagram
Ensuring high-quality care in healthcare settings requires a thorough understanding of root causes behind issues. The Fishbone Diagram for Healthcare template helps you analyze potential causes of problems in areas like patient care, staff performance, and administrative processes. This structured approach facilitates comprehensive analysis and collaborative problem-solving, ultimately leading to improved healthcare outcomes and patient satisfaction.
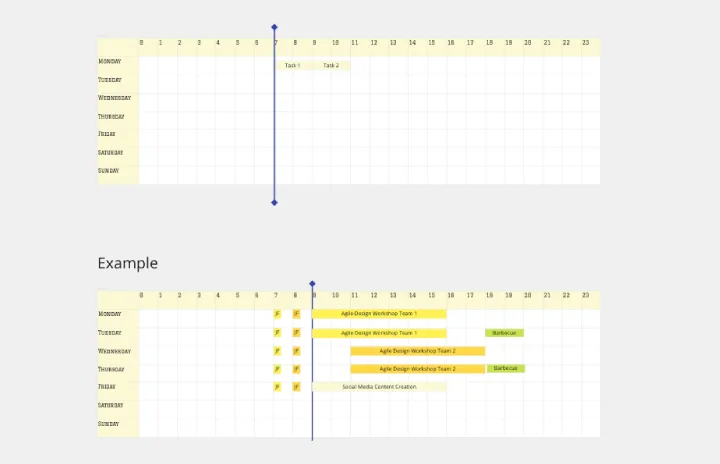
Weekly Planner by Elina Schäfer
Weekly Planner template is perfect for organizing your weekly tasks and schedules. It helps you prioritize activities, set deadlines, and manage your time effectively, ensuring you stay productive and on track throughout the week.
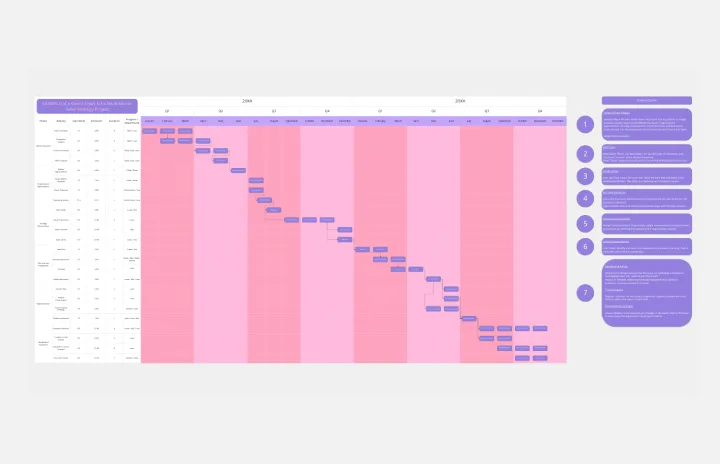
Sales Strategy Gantt Chart
Works best for:
Strategy, Planning
Creating and executing a sales strategy requires meticulous planning. The Sales Strategy Gantt Chart template helps you map out every step of your strategy, from goal setting to implementation and review. Visualize key activities, set timelines, and assign tasks to ensure your sales team stays focused and aligned. This template enables you to track progress, measure performance, and make data-driven adjustments for better sales outcomes.
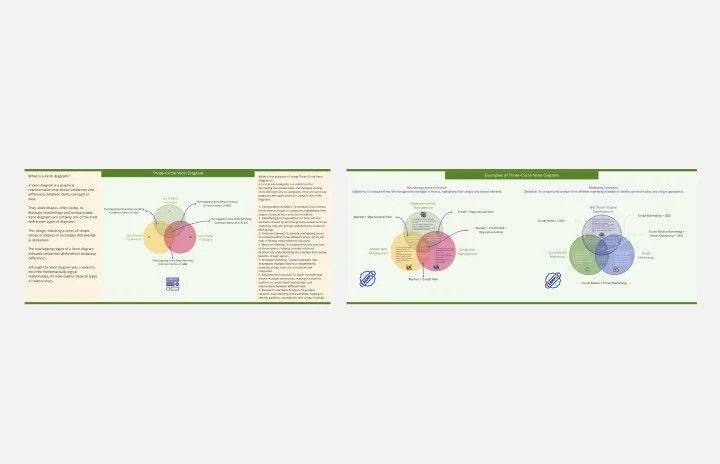
Three-Circle Venn Diagram
Works best for:
Venn Diagram
The Three Circle Venn Diagram template allows you to explore the relationships between three different sets. Use it to identify shared characteristics, unique attributes, and intersections. This tool is ideal for comparing multiple concepts or categories, facilitating strategic planning, problem-solving, and decision-making. Perfect for educators, researchers, and business professionals looking to analyze complex data visually and effectively.
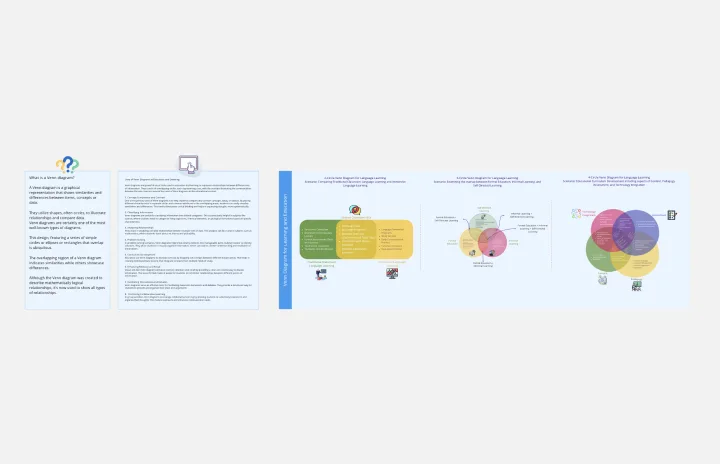
Venn Diagram for Learning and Education
Works best for:
Venn Diagram
Enhance learning and teaching with the Venn Diagram for Learning and Education template. Use it to compare concepts, illustrate relationships, and facilitate discussions. This template helps students and educators organize information visually, making complex ideas easier to understand and retain. It's an excellent tool for classrooms, study groups, and professional training sessions, promoting deeper understanding and active learning.
Timeline-Retrospective
Works best for:
Timeline, Planning
Use the Timeline Retrospective template to review project progress and outcomes. It’s ideal for identifying what worked well and what didn’t, facilitating continuous improvement. This template helps teams reflect on their performance and make informed decisions for future projects.