Venn Diagram Practical Applications
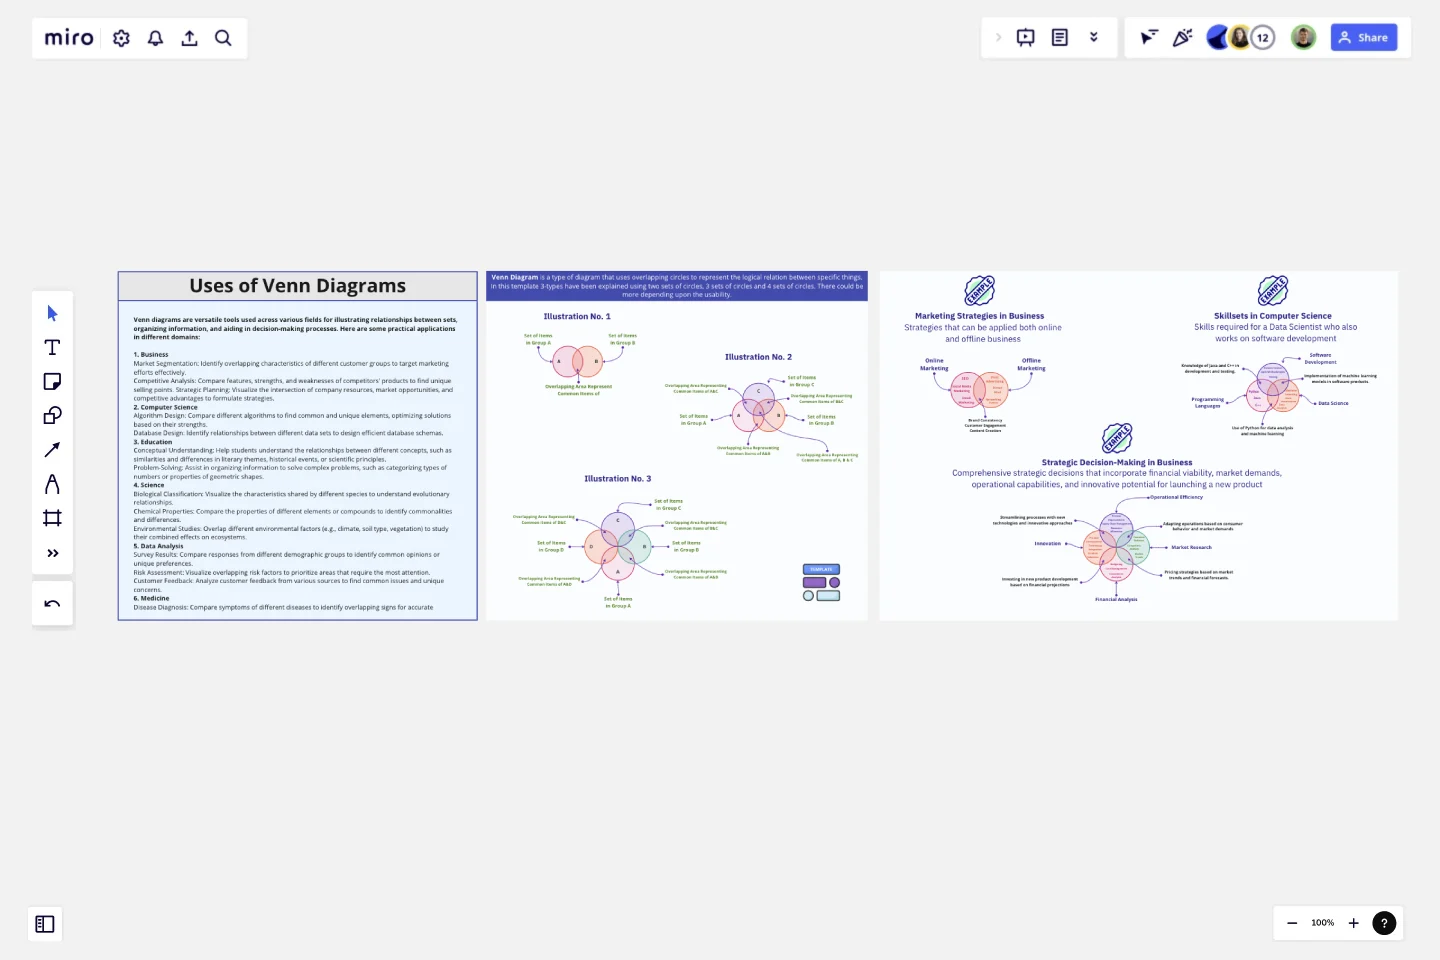
The "Venn Diagram Practical Applications" template is designed to help users visualize and analyze the relationships between different sets of data using Venn diagrams.
This template is ideal for professionals, educators, and students across various fields such as business, computer science, and strategic planning. It provides a clear and effective way to compare and contrast different elements, identify commonalities, and uncover unique attributes.
Key Features:
Versatile Use Cases: Demonstrates practical applications of Venn diagrams in real-life scenarios across multiple domains.
Different Diagram Configurations: Includes examples with two-circle, three-circle, and four-circle Venn diagrams to cater to varying levels of complexity.
Interactive Elements: Allows users to add, edit, and customize the diagram content based on their specific needs and data sets.
Visual Clarity: Uses distinct colors and overlapping areas to clearly depict intersections and differences between sets.
How to Use:
Two-Circle Venn Diagram:
Description: Ideal for comparing two different sets or groups.
Example: Comparing the features of two competing products in the market.
Set A: Product X features (e.g., Price, User Interface)
Set B: Product Y features (e.g., Battery Life, Customer Support)
Intersection: Common features (e.g., Availability, Warranty)
Three-Circle Venn Diagram:
Description: Useful for comparing three different sets or groups to find commonalities and unique characteristics.
Example: Overlapping skill sets in a project team.
Set A: Skills of Team Member A (e.g., Coding, Design)
Set B: Skills of Team Member B (e.g., Marketing, Design)
Set C: Skills of Team Member C (e.g., Coding, Project Management)
Intersections: Areas where two or three members share skills.
Four-Circle Venn Diagram:
Description: Best for complex comparisons involving four different sets or groups.
Example: Market segmentation analysis for a new product launch.
Set A: Segment 1 (e.g., Age Group 18-25)
Set B: Segment 2 (e.g., Income Level High)
Set C: Segment 3 (e.g., Geographical Region A)
Set D: Segment 4 (e.g., Interest in Technology)
Intersections: Identifying the core target audience that falls into multiple segments.
Practical Applications:
Business: Analyzing market segments, comparing product features, and identifying strategic opportunities.
Computer Science: Visualizing algorithm performance, comparing programming languages, and mapping software functionalities.
Strategies: Developing strategic plans, understanding competitive landscapes, and aligning organizational goals.
Benefits:
Enhanced Understanding: Simplifies the comparison and analysis of multiple sets of data.
Improved Decision Making: Helps identify commonalities and differences that can inform strategic decisions.
Versatile Tool: Applicable across various fields and scenarios, making it a valuable tool for diverse users.
This template was created by Khawaja Rizwan.
Get started with this template right now.
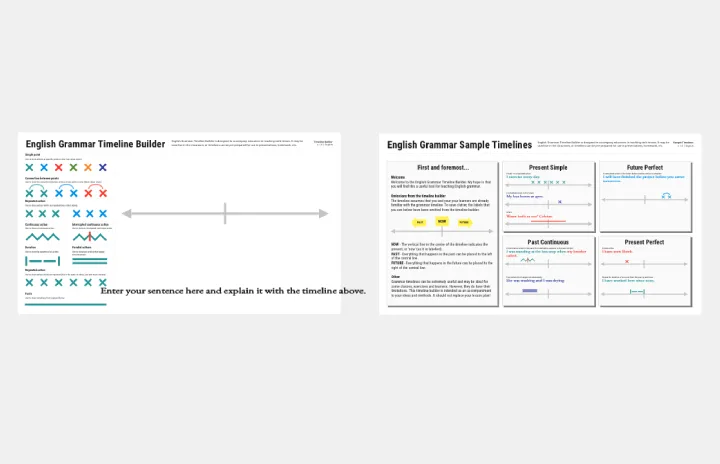
English Grammar Timeline Builder
The English Grammar Timeline template helps you map out the progression of grammar concepts over time. This is a great tool for educators and students to visualize the sequence and relationship between different grammar topics, making learning and teaching more effective.
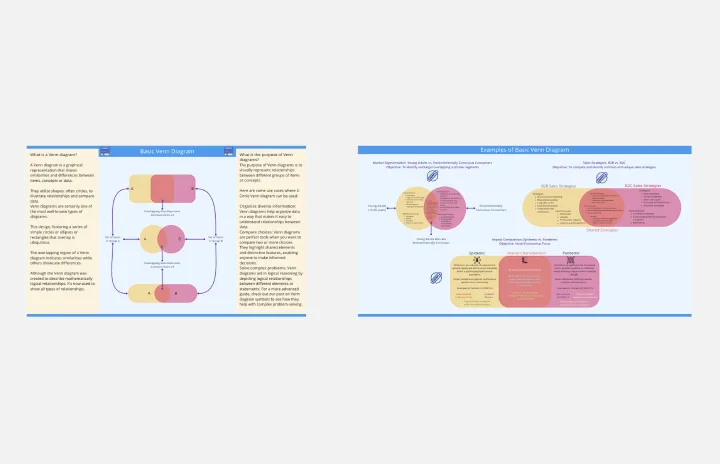
Basic Venn Diagram
Works best for:
Venn Diagram
The Basic Venn Diagram template is a simple yet powerful tool for visualizing relationships between different sets. Use it to compare and contrast concepts, identify commonalities and differences, and organize information logically. This template is perfect for brainstorming, teaching, and presentations, making complex information more accessible and understandable. Ideal for educators, students, and professionals in various fields.
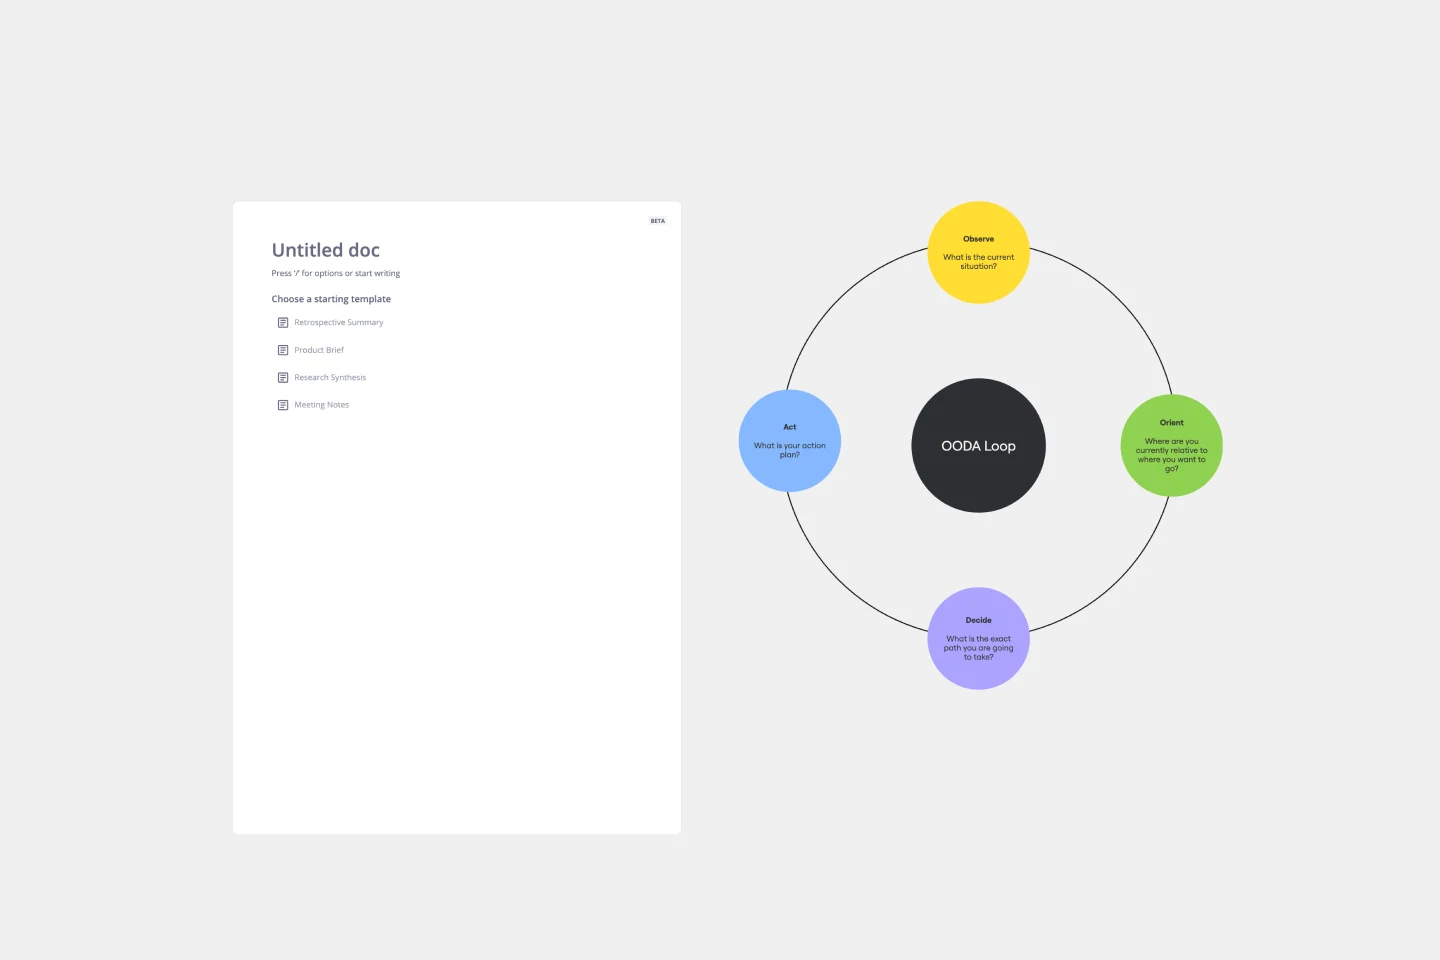
OODA Loop Template
Works best for:
Strategic Planning, Strategy
The OODA Loop template helps optimize decision-making processes by using four key stages- Observe, Orient, Decide, and Act. Its well-structured layout allows teams to systematically break down complex decisions, leading to a shared understanding of the decision-making workflow. One of the key benefits of the template is its ability to enhance collaboration. Teams can seamlessly contribute to and iterate upon the decision-making cycle in real time, resulting in more informed decisions and a more efficient process. The template provides a clear and visual representation of each stage, accelerating the decision-making process and fostering a collaborative environment where teams can work together to navigate challenges and make well-informed decisions.
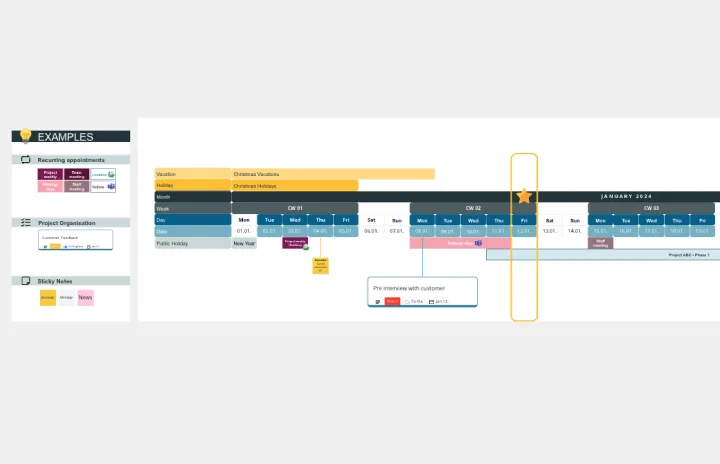
Workday Calendar - Timeline 2024
Works best for:
Planning, Timeline
The Workday Calendar Timeline 2024 template is ideal for planning your work year. It helps you organize work schedules, track important deadlines, and plan for holidays and events. This template ensures you stay productive and on top of your work commitments.
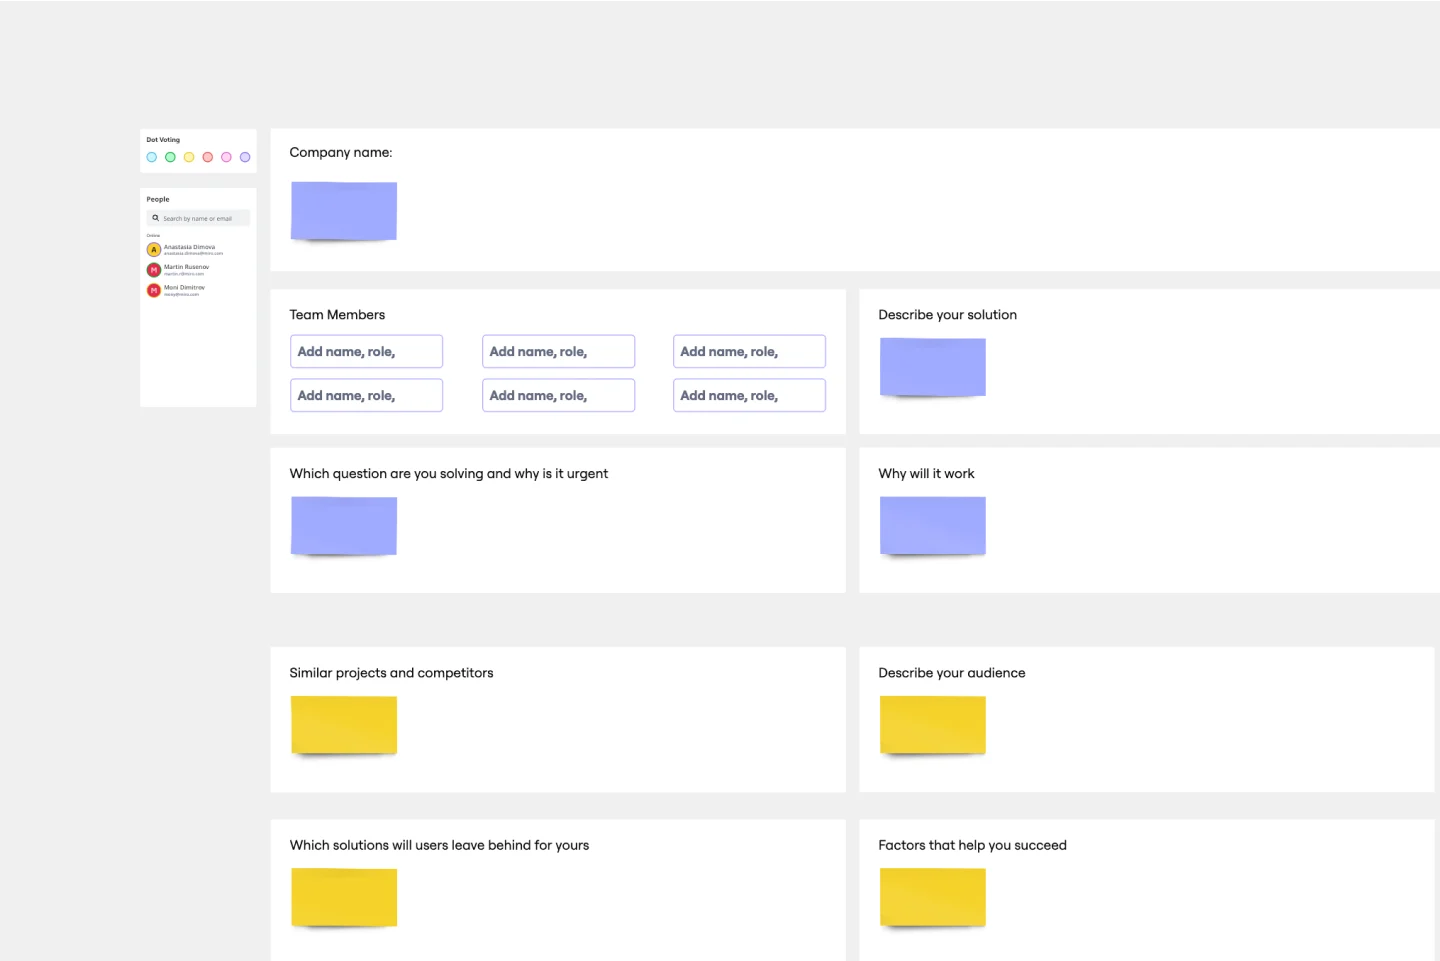
Startup Canvas Template
Works best for:
Leadership, Documentation, Strategic Planning
A Startup Canvas helps founders express and map out a new business idea in a less formal format than a traditional business plan. Startup Canvases are a useful visual map for founders who want to judge their new business idea’s strengths and weaknesses. This Canvas can be used as a framework to quickly articulate your business idea’s value proposition, problem, solution, market, team, marketing channels, customer segment, external risks, and Key Performance Indicators. By articulating factors like success, viability, vision, and value to the customer, founders can make a concise case for why a new product or service should exist and get funded.
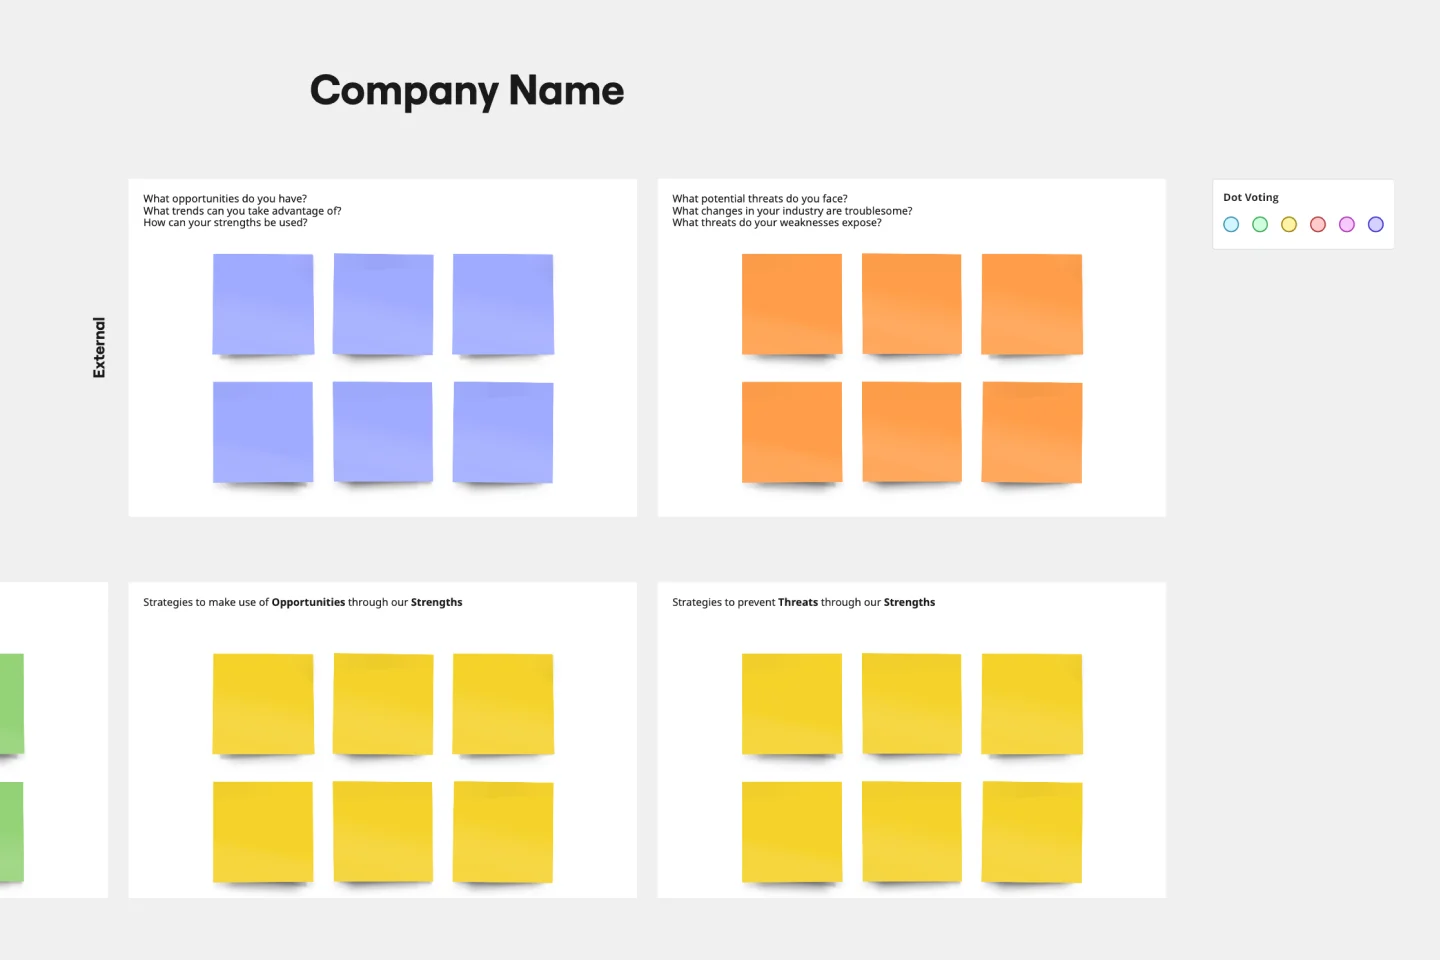
SWOT Analysis Template
Works best for:
Decision Making, Strategic Planning, Prioritization
When you’re developing a business strategy, it can be hard to figure out what to focus on. A SWOT analysis helps you hone in on key factors. SWOT stands for Strengths, Weaknesses, Opportunities, and Threats. Strengths and weaknesses are internal factors, like your employees, intellectual property, marketing strategy, and location. Opportunities and threats are usually external factors, like market fluctuations, competition, prices of raw materials, and consumer trends. Conduct a SWOT analysis whenever you want to explore opportunities for new businesses and products, decide the best way to launch a product, unlock your company’s potential, or use your strengths to develop opportunities.