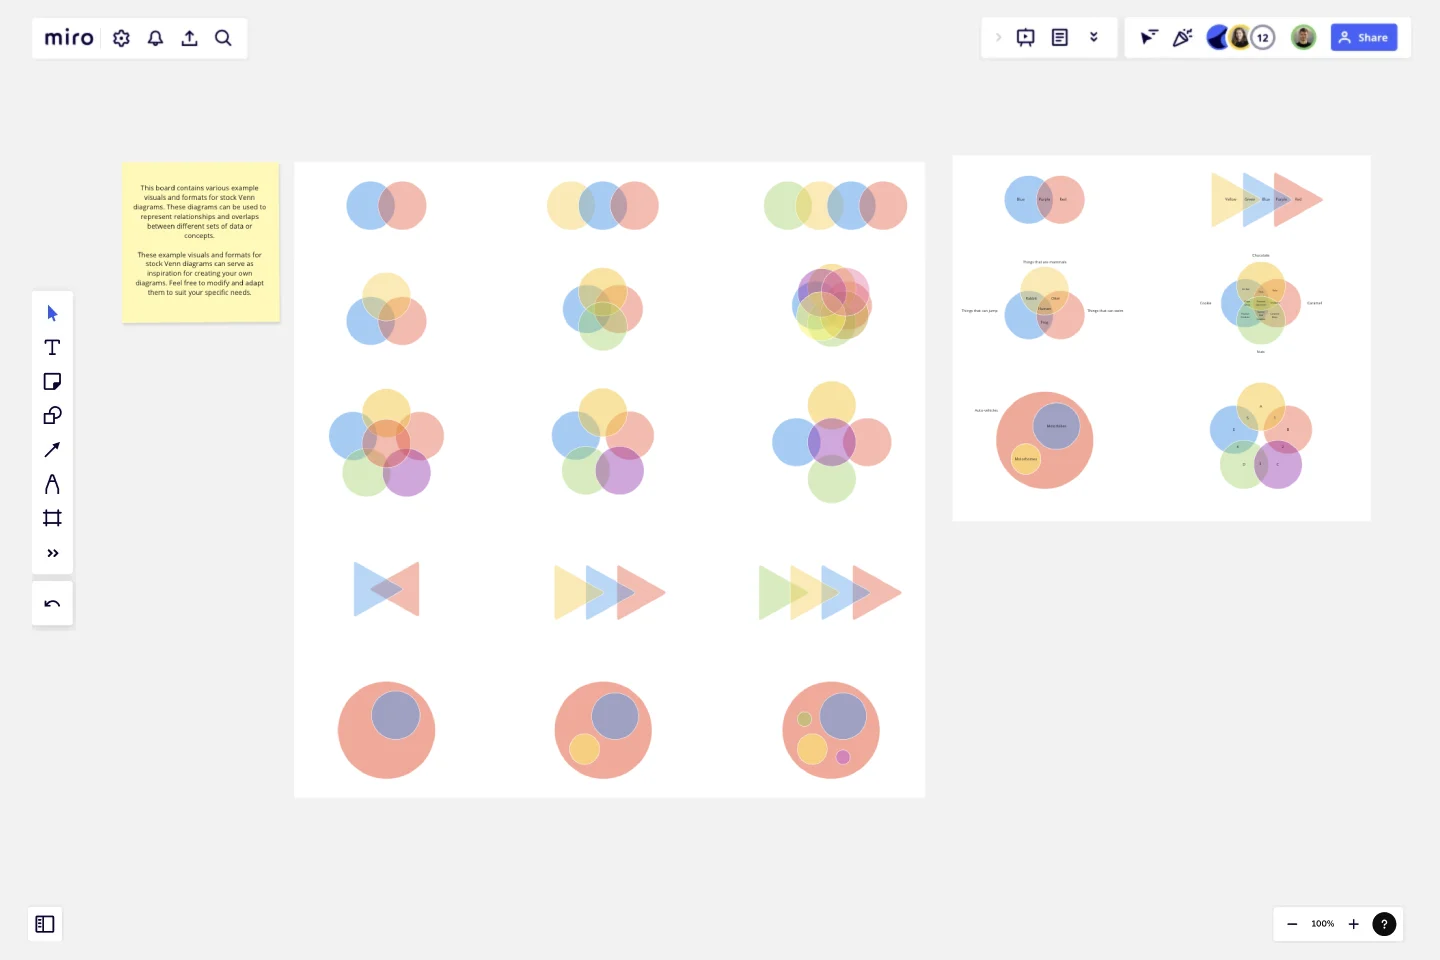
Venn Diagrams by Dave Westgarth
Explore a collection of pre-made Venn diagrams on this board!
These powerful visual tools illustrate relationships between different sets or groups of items. With various sizes and arrangements, these diagrams help you gain insights into overlapping characteristics, identify commonalities or differences, and analyze complex data sets. Use these Venn diagrams for brainstorming, problem-solving, and organizing information.
Check out this board in the Miroverse and enhance your projects with these ready-to-use diagrams!
This template was created by Dave Westgarth.
Get started with this template right now.
Strategic Group Mapping Template
Works best for:
Mapping, Strategy
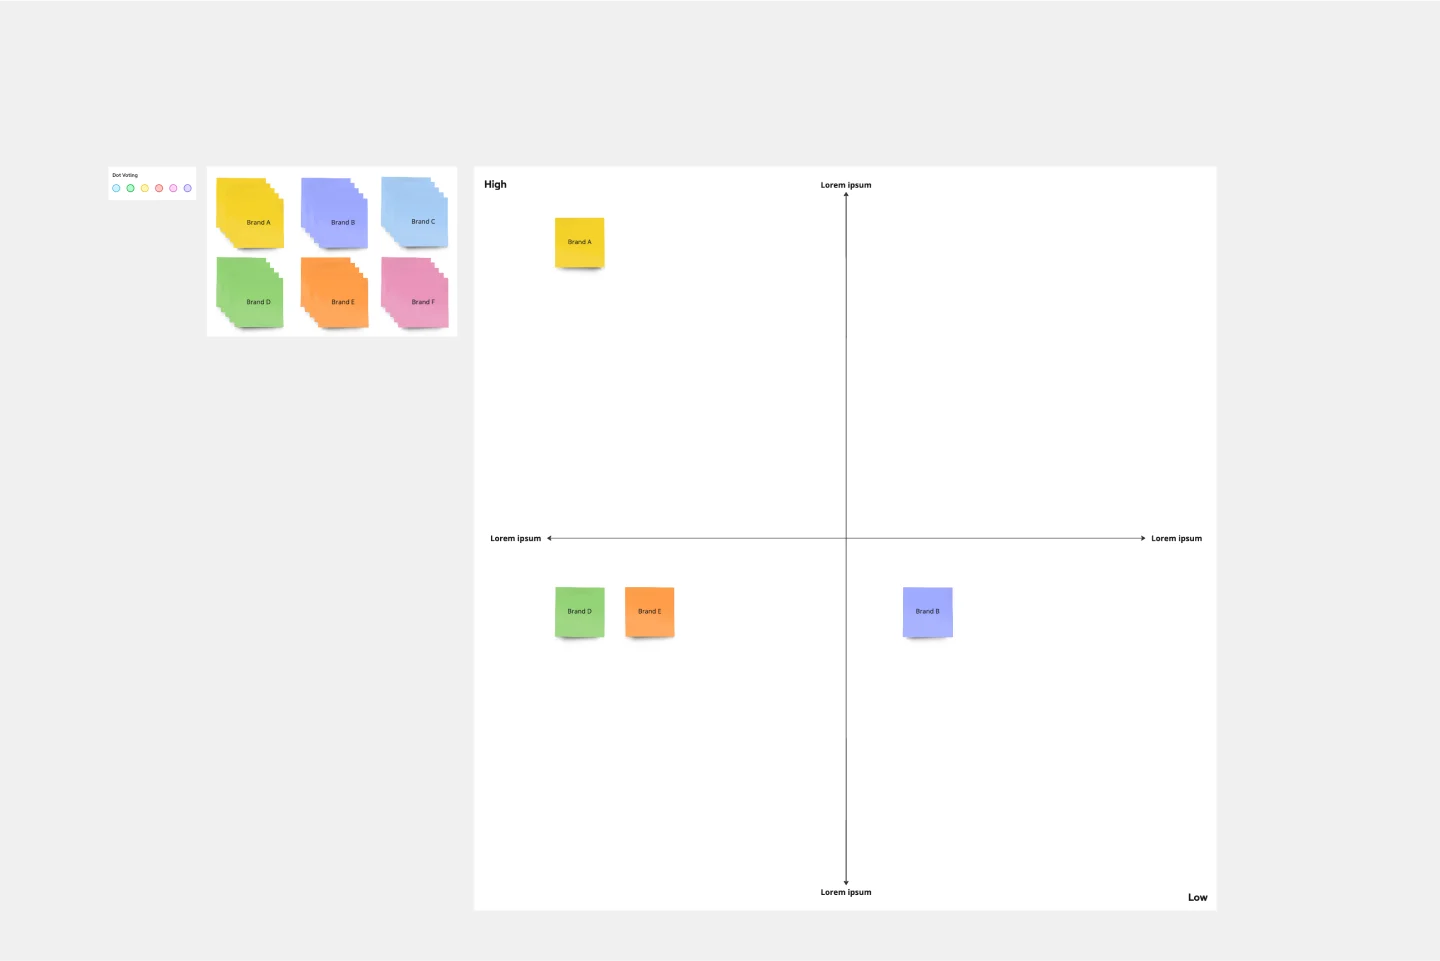
The Strategic Group Mapping Template is a cutting-edge visual tool designed to translate the competitive landscape of their industry. By allowing users to plot entities based on distinct criteria, this template provides an at-a-glance view of market dynamics. One standout benefit of using this tool is its ability to identify clusters of competitors and market gaps, paving the way for businesses to strategically position themselves for optimal success.
5-Set Venn Diagram
Works best for:
Venn Diagram
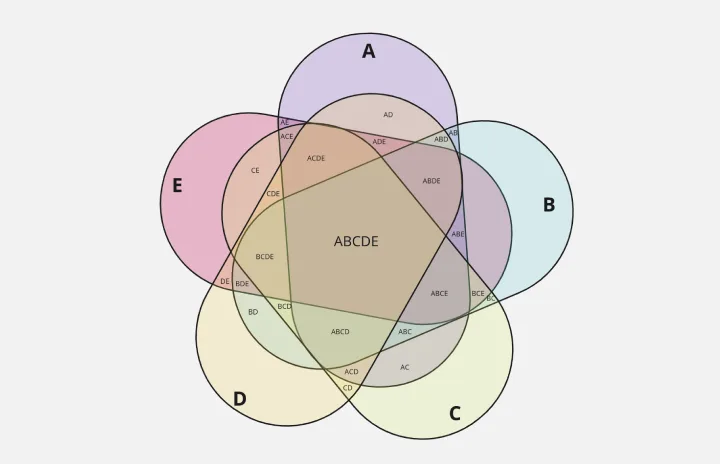
Analyze complex data with the 5 Set Venn Diagram template. This tool allows you to compare and contrast five different sets of data, highlighting intersections and unique elements. Perfect for in-depth data analysis, research, and strategic planning. Ideal for analysts, researchers, and educators looking to present comprehensive data insights in a clear and visual manner.
LUMINAI Refinery Advisor on AWS Template
Works best for:
AWS
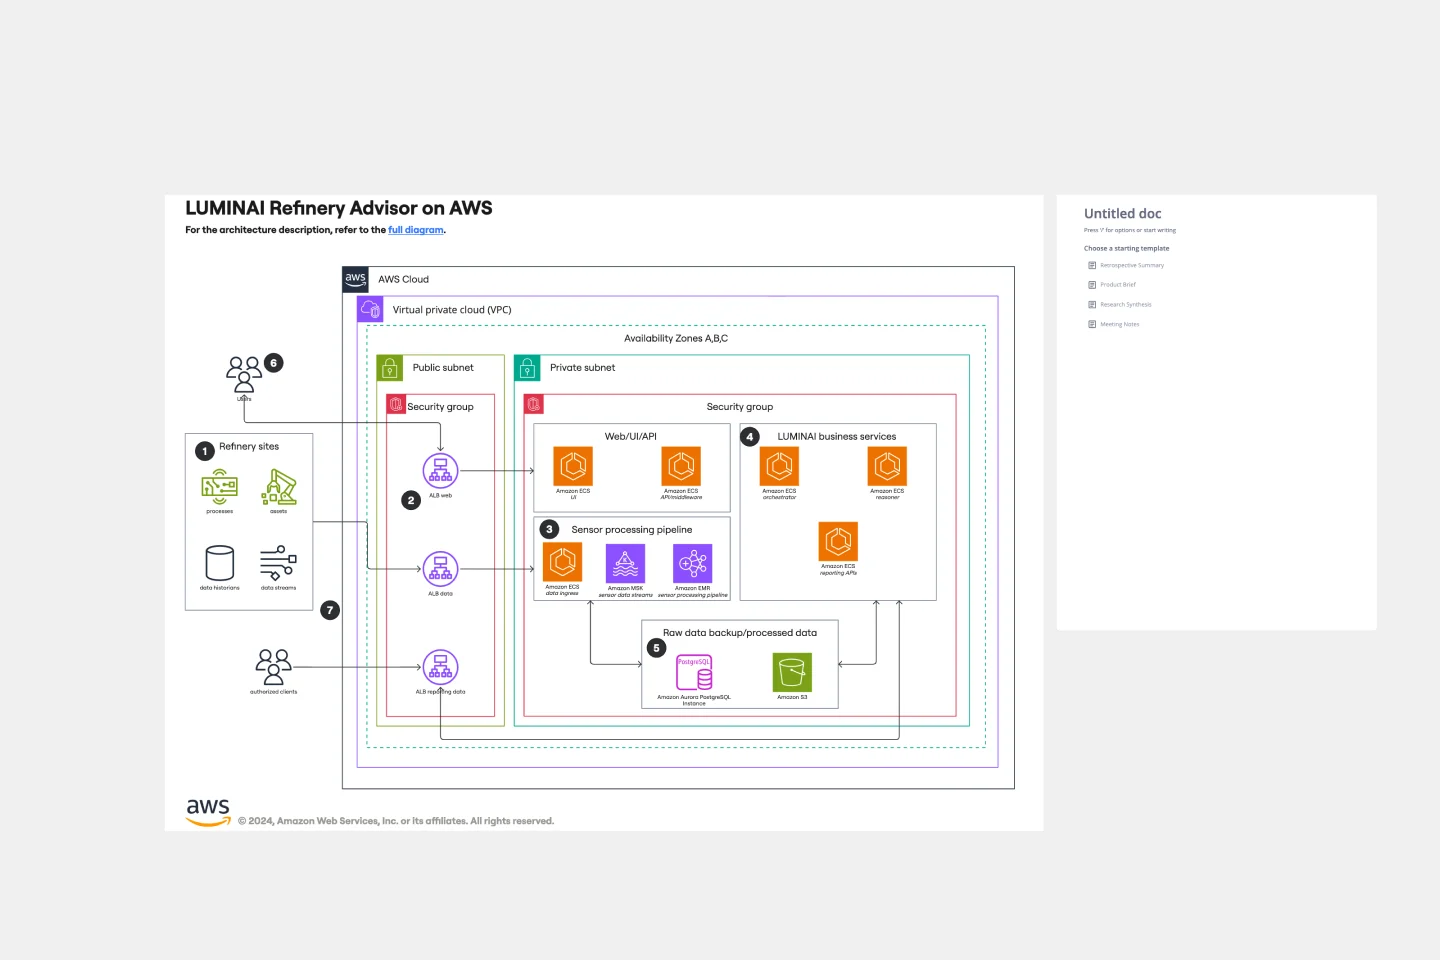
The LUMINAI Refinery Advisor on AWS template streamlines and optimizes refinery operations through AWS. It provides a structured approach to setting up and managing AWS services, tailored specifically for engineers, developers, and data scientists in the refinery sector. This template not only saves time and effort by offering a predefined structure and best practices but also allows for customization to meet specific operational needs. With its focus on enhancing data processing capabilities, the LUMINAI Refinery Advisor on AWS template is an invaluable resource for improving the efficiency, effectiveness, and optimization of refinery processes on the AWS platform.
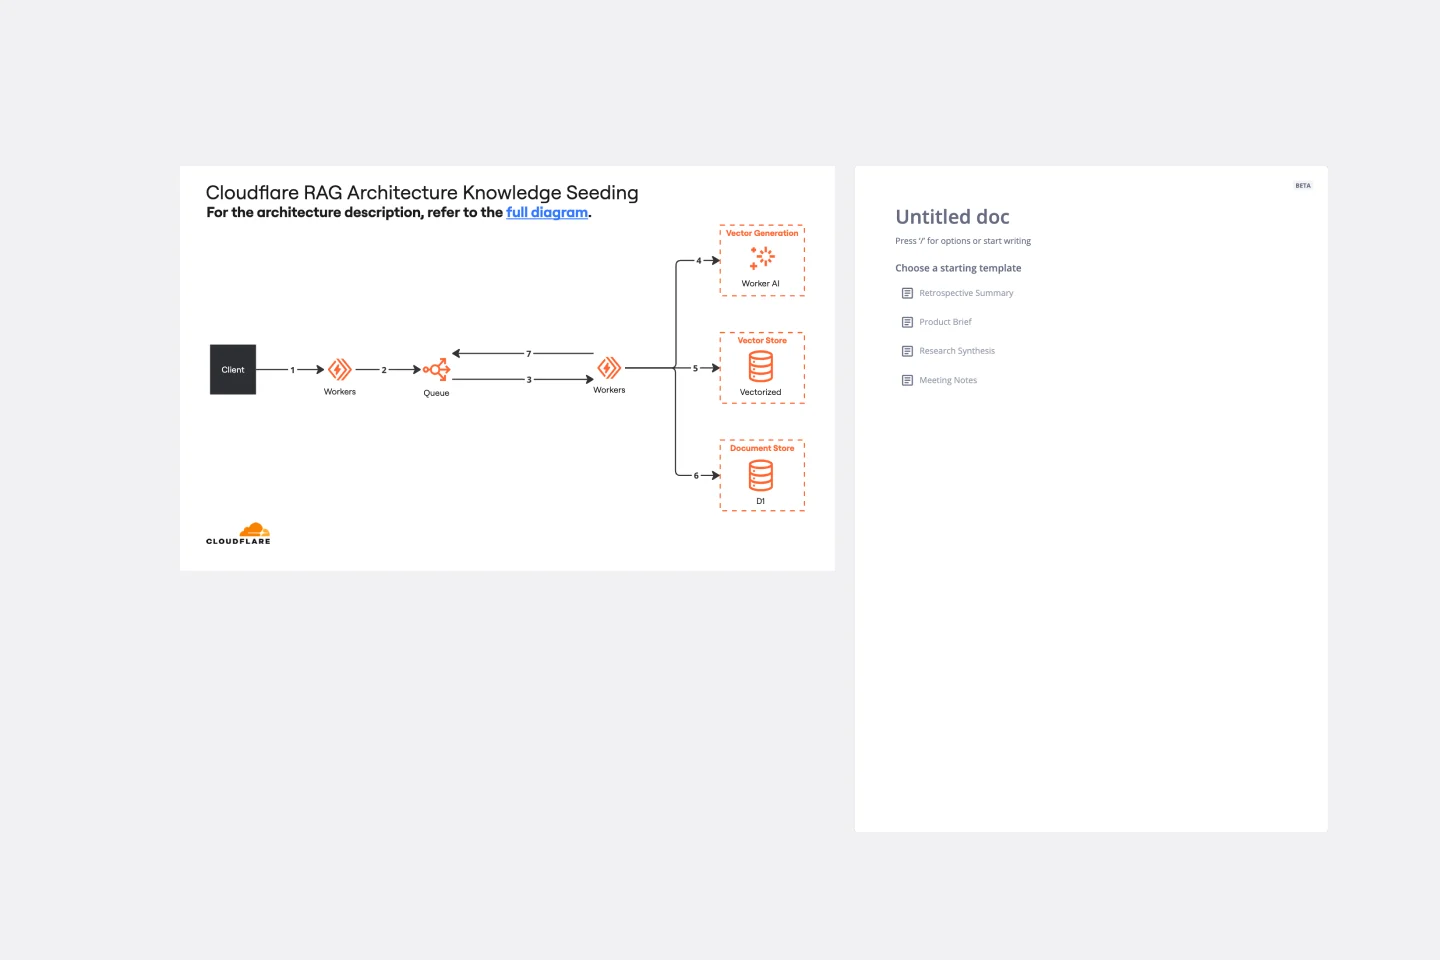
Cloudflare RAG Architecture Knowledge Seeding Template
The Cloudflare RAG Architecture Knowledge Seeding template in Miro streamlines the sharing and visualization of cloud architecture knowledge, making it ideal for tasks like cloud infrastructure optimization and diagram creation. This template enables straightforward documentation and collaboration, ensuring complex information is accessible to all team members.
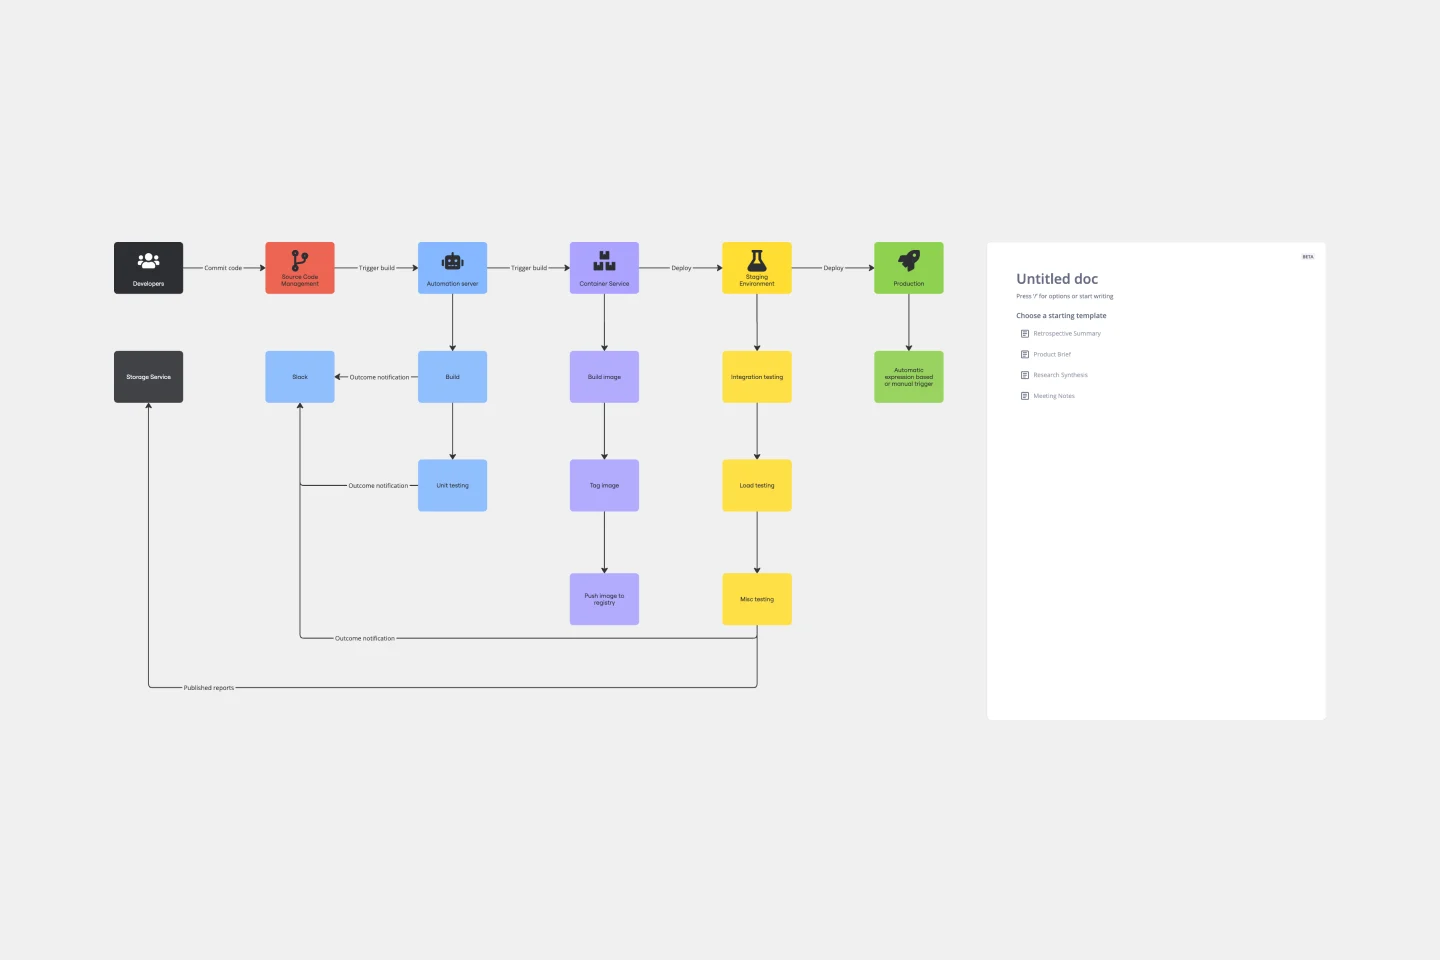
CI/CD Pipeline Diagram Template
Works best for:
Diagramming, Development
The CI/CD template is a well-designed roadmap for software deployment that enables a smooth and automated flow from development to production. This strategic layout includes critical elements such as source code management, automation servers, container orchestration, staging environments, and the final deployment to production. One of the key benefits of using such a template is that it builds a robust deployment pipeline, which significantly reduces manual intervention and human error. By visualizing each step and integrating automation throughout, teams can achieve faster deployment cycles, ensuring that new features, updates, and fixes are delivered to users promptly and reliably. This enhanced pace does not compromise quality, as the template inherently supports continuous testing and quality assurance, ensuring that each update is quick but also secure and stable before it is delivered to the end user.
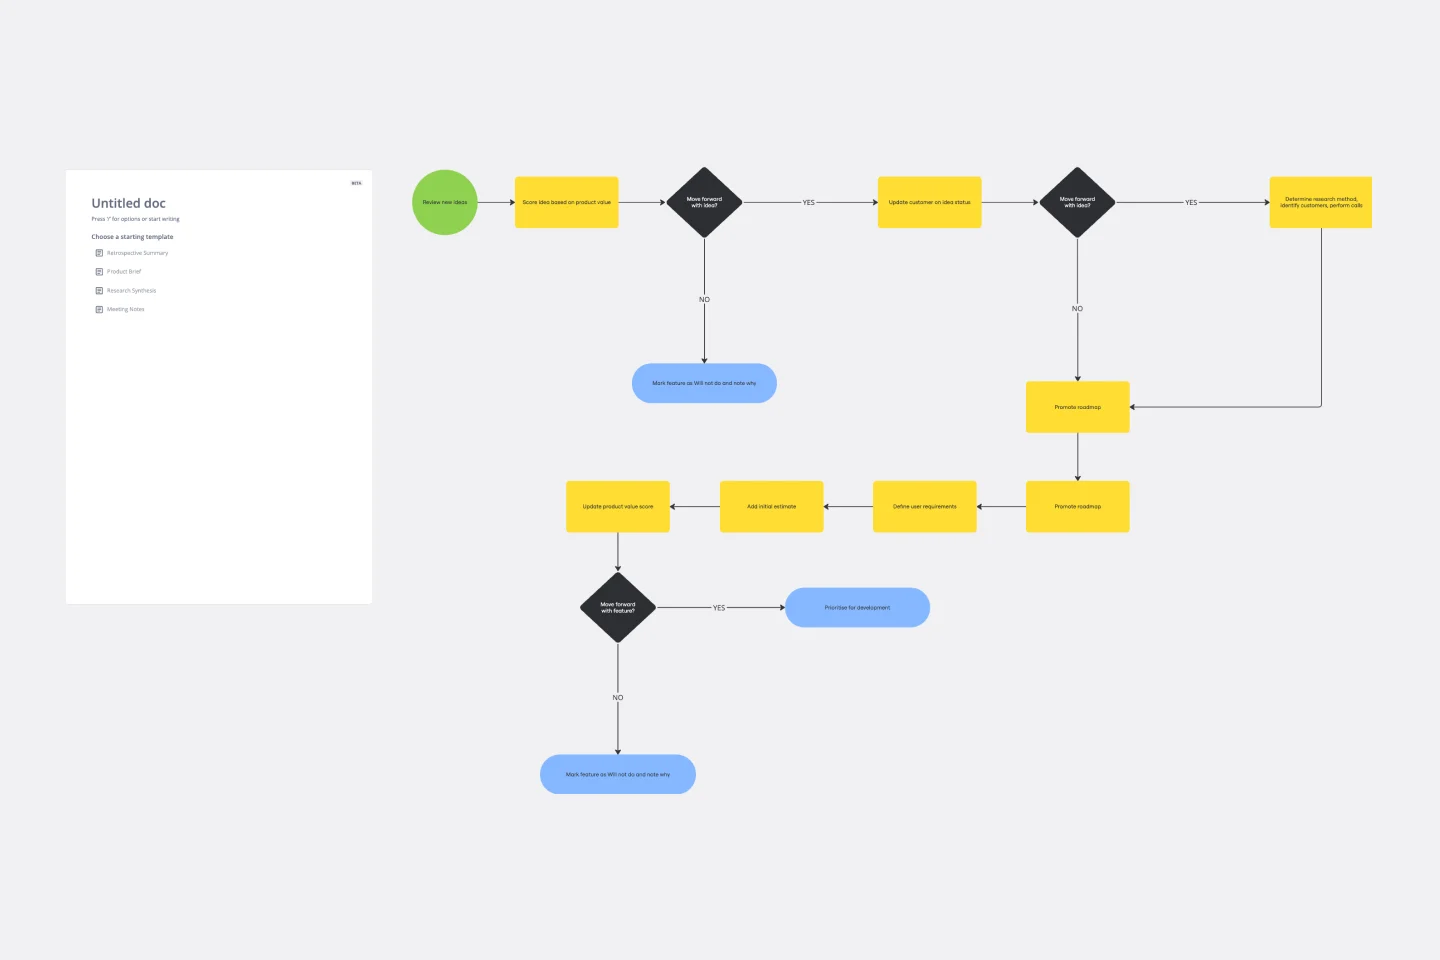
Workflow Diagram Template
Works best for:
Diagramming, Mapping, Process mapping
The Workflow Diagram Template maps out and represents processes or systems using standardized symbols and shapes. By delineating the various steps or stages in a process, it ensures that tasks flow seamlessly from initiation to completion. One of the standout benefits of using this template is its clarity. By translating processes into a visual format, all participants can gain a comprehensive understanding at a glance, eliminating confusion and ensuring everyone is on the same page. This clarity not only promotes efficient task execution but also fosters collaboration among team members.